
Global Furniture Export Rankings: Growth and Manufacturing Leaders
Global furniture exports provide a valuable indicator of international manufacturing competitiveness and changing production patterns. Based on official trade statistics from UN Comtrade, Eurostat Comext and supporting national sources, this analysis ranks the world's largest furniture exporters and examines long-term export growth and export intensity across the leading manufacturing countries.
By combining export values, 10-year growth trends and exports per capita, the analysis highlights where global furniture manufacturing is concentrated, which countries are gaining market share, and where the industry is most specialised.
Top Furniture Exporting Countries
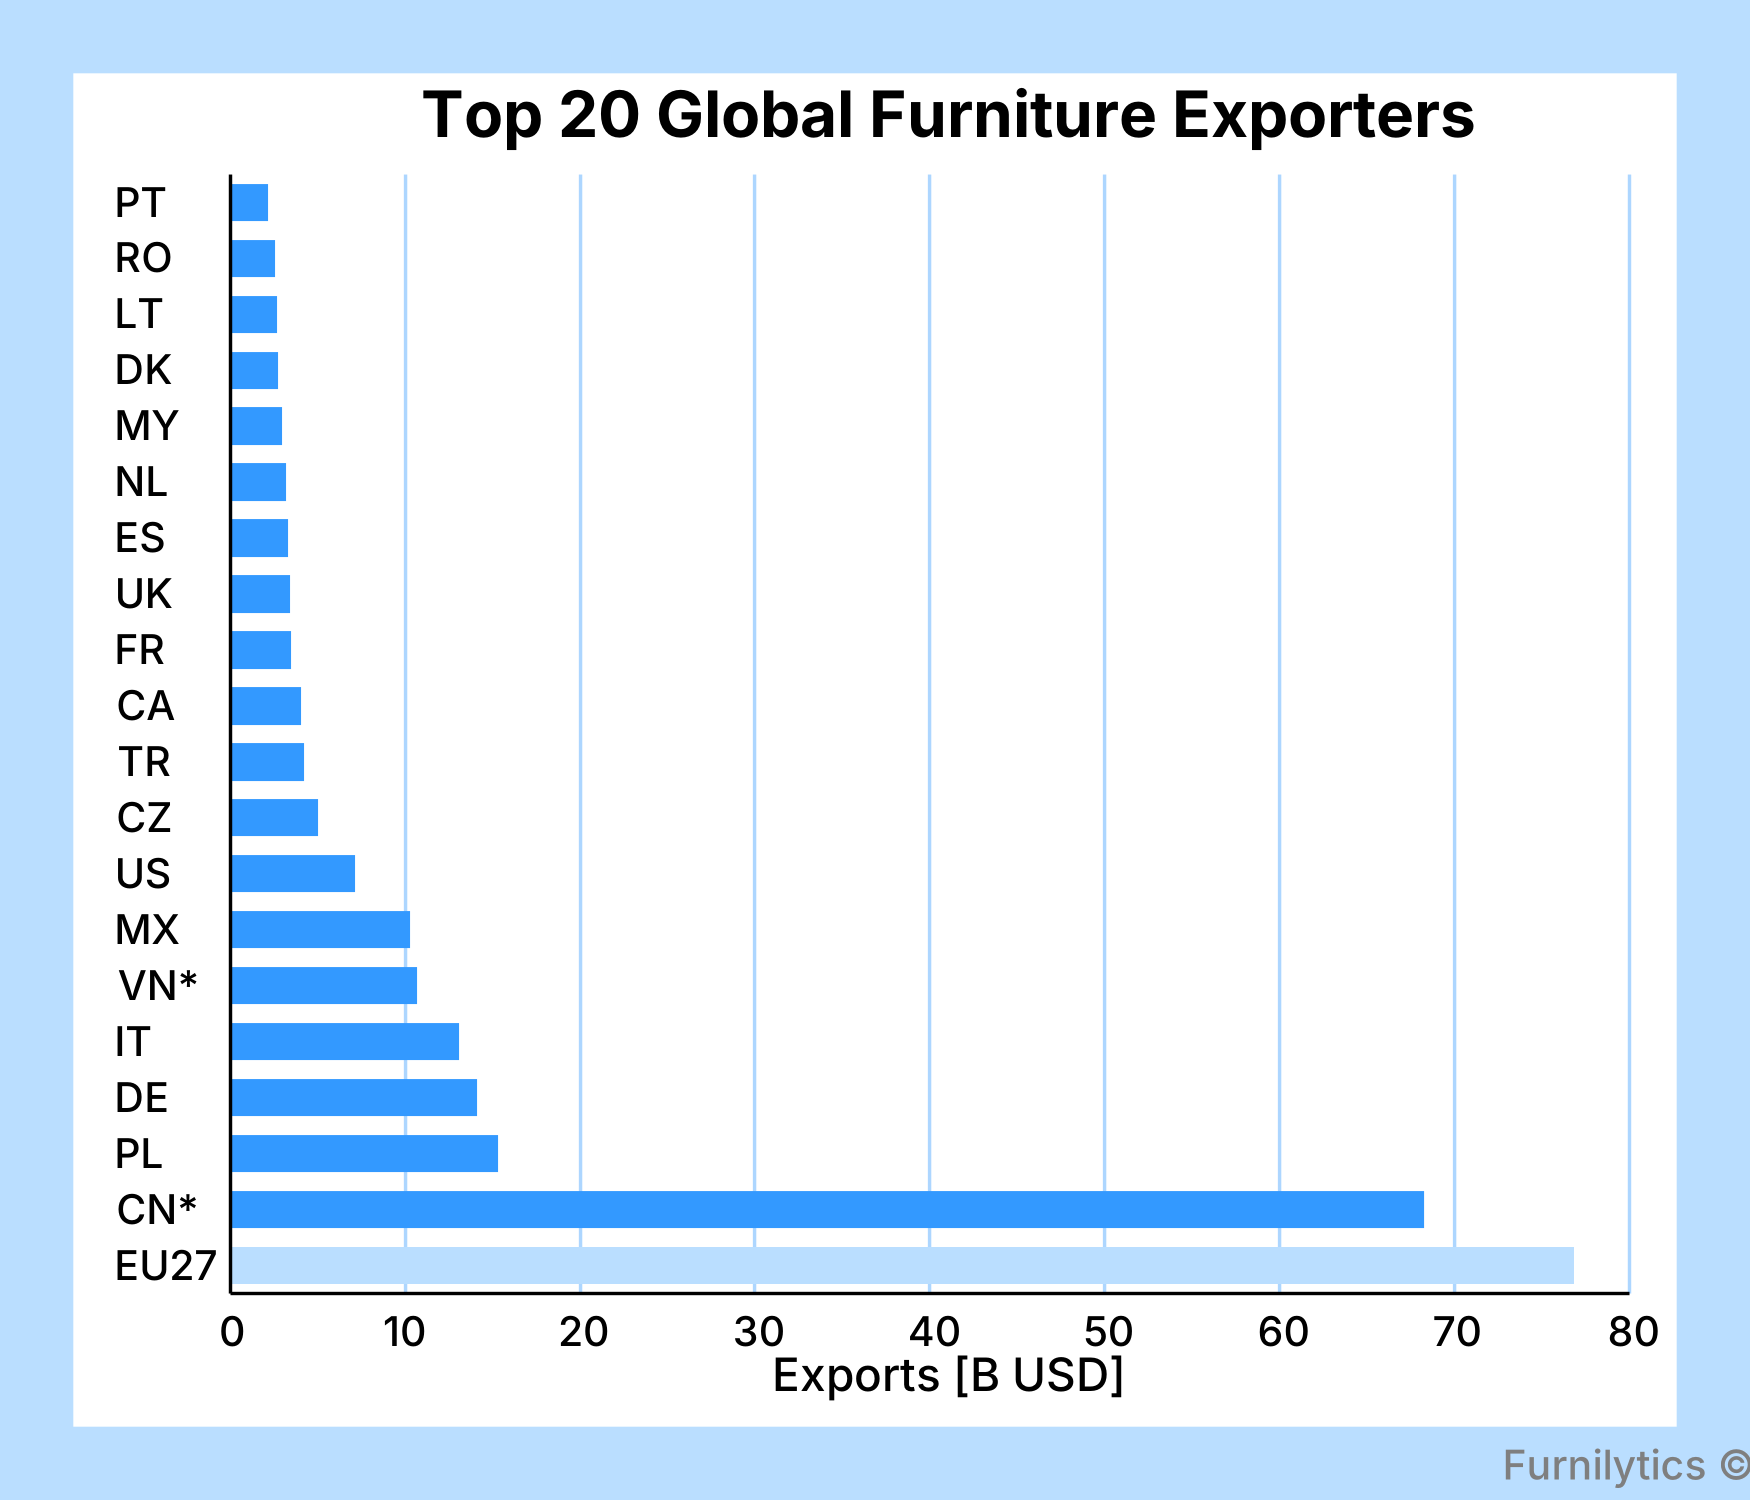
Global furniture exports reached approximately USD 203 billion over the latest 12-month period. The EU27 remains the world's largest furniture exporting region with USD 76.8 billion, accounting for 37.8% of global exports. Around 69% of EU27 furniture exports remain within the Single Market, leaving approximately USD 24.1 billion exported to destinations outside the EU. China follows as the largest individual exporter at USD 68.2 billion, representing 33.6% of worldwide furniture trade. Together, the top ten exporters account for nearly three-quarters (74.9%) of global exports, highlighting the concentrated nature of international furniture manufacturing.
Europe's strength extends well beyond the EU27 aggregate. Eleven of the world's twenty largest furniture exporters are EU member states, led by Poland (USD 15.3 billion), Germany (USD 14.1 billion) and Italy (USD 13.1 billion). Outside Europe, Vietnam and Mexico have established themselves as major global manufacturing hubs, each exporting more than USD 10 billion of furniture over the past twelve months.
Long-Term Growth in Furniture Exports
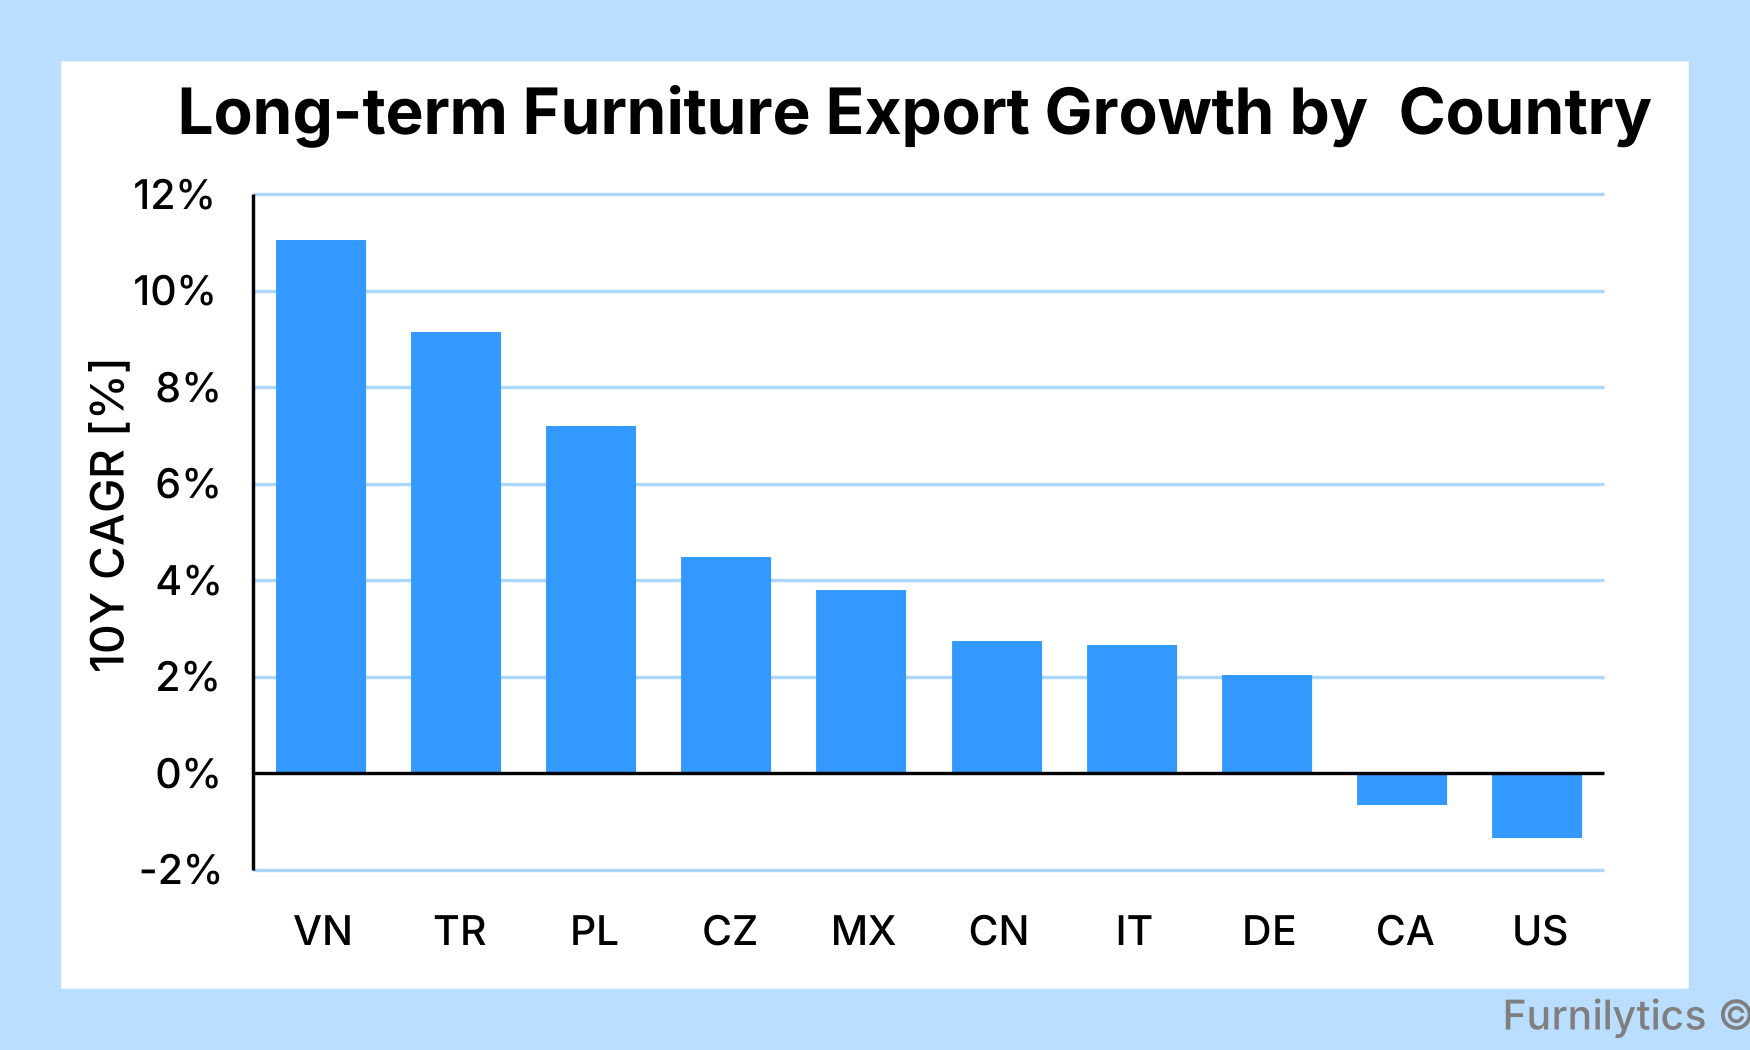
The global furniture export landscape has changed considerably over the past decade. Vietnam recorded the strongest long-term growth among the world's leading exporters, increasing exports from USD 5.1 billion in 2015 to USD 10.7 billion over the latest twelve months. Turkey and Poland also posted sustained expansion, with annual growth rates of 9.1% and 7.2%, respectively. Poland's exports increased from USD 8.9 billion to USD 15.3 billion, reinforcing its position as Europe's largest furniture exporter.
Among the largest established exporters, China continued to expand from USD 53.5 billion in 2015 to USD 68.2 billion today, although recent estimates indicate that exports softened by approximately 2.3% compared with the previous year. Germany, Italy and Mexico also maintained positive long-term growth, highlighting the resilience of their manufacturing sectors despite increasingly competitive global markets.
In contrast, Canada and the United States were the only countries in the comparison to record negative export growth over the past decade, suggesting that export expansion has increasingly shifted towards Europe and Asia.
Furniture export specialisation
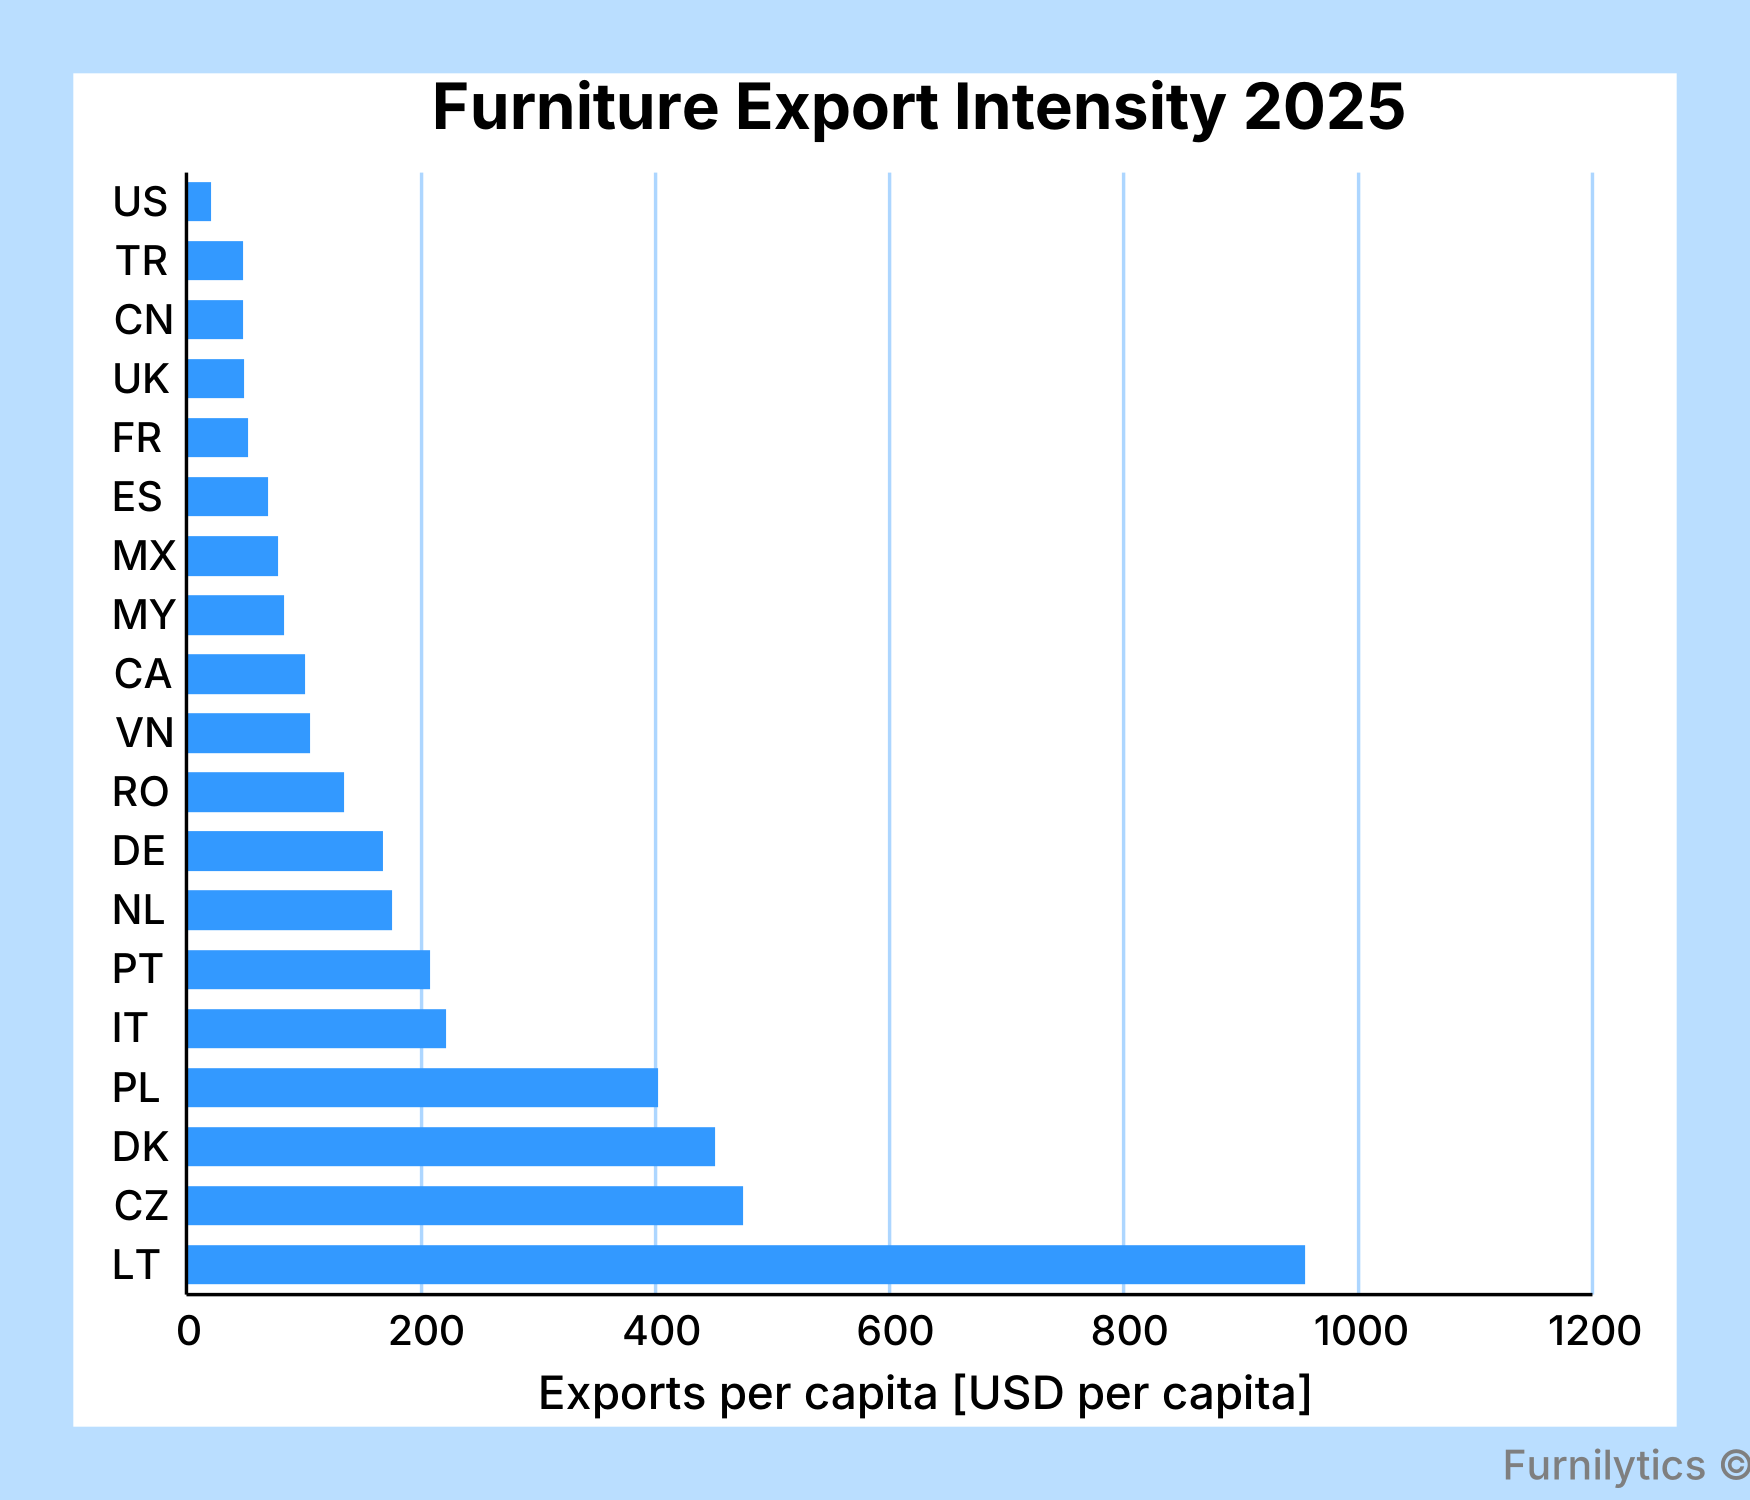
Absolute export values only tell part of the story. When adjusted for population, the ranking changes considerably and highlights countries where furniture manufacturing plays a particularly important economic role. Lithuania ranks first with USD 955 of furniture exports per resident, followed by Czechia (USD 475), Denmark (USD 451) and Poland (USD 402).
The ranking underlines the importance of Central and Eastern Europe within the global furniture industry. Several countries in the region combine relatively small domestic markets with highly export-oriented manufacturing sectors, making furniture production a significant contributor to industrial output and international trade.
In contrast, larger economies such as China, France, the United Kingdom and the United States rank much lower on a per-capita basis. While these countries export substantial furniture volumes in absolute terms, furniture manufacturing represents a smaller share of their overall economies.
Conclusion
Global furniture exports remain highly concentrated, with the EU27 retaining its position as the world's largest exporting region and China remaining the leading individual exporter. At the same time, the industry's centre of gravity continues to evolve, with countries such as Vietnam, Turkey and Poland recording the strongest long-term export growth. When adjusted for population, Central and Eastern Europe stands out as the world's most specialised furniture manufacturing region, underlining its continued importance within global furniture supply chains.
Sources:
UN Comtrade Database
Eurostat – International Trade in Goods (Comext)
U.S. Census Bureau – International Trade Data
UN DESA – World Population Prospects 2024
Methodology & limitations:
Global furniture export values are based on international trade statistics covering HS 9401–9403 (seats, medical and specialised furniture, and other furniture and furniture parts). Current export values are primarily derived from exporter-reported UN Comtrade data using the latest available 12-month period. EU27 totals are aggregated from Eurostat Comext international trade statistics, while China and Vietnam are estimated using a hybrid now-casting methodology combining EU and US partner-reported import data with receiver-reported UN Comtrade statistics to account for reporting lags. Long-term growth is calculated as the compound annual growth rate (CAGR) between 2015 annual exports and the latest available or estimated export values. Export intensity is calculated by dividing current furniture exports by the estimated 2025 population from the UN World Population Prospects.
The analysis is intended to compare the relative scale, long-term development and export specialisation of major furniture-exporting countries rather than provide precise national trade balances. Comparability may be affected by reporting lags, differences between exporter- and importer-reported trade statistics, revisions to official trade data, exchange-rate effects and the use of now-cast estimates for recent periods, particularly for China and Vietnam.