
Vietnam Furniture Exports in H1 2026: Slowing Growth
Vietnam furniture exports have become a central part of the global furniture supply chain. Over the past decade, Vietnam has grown into one of the leading furniture export hubs, supported by strong US demand, competitive production costs and sourcing shifts away from China. Earlier Furnilytics analysis showed how Vietnam’s furniture industry became increasingly export-driven, while rising US tariffs created new pressure on its most important market.
This update reviews the latest Vietnam furniture export data through July 2026. It examines overall export growth, regional export performance, the role of the US market and Vietnam’s exposure to changing US furniture import demand. The results show that Vietnam remains a major furniture supplier, but export growth has slowed and market concentration remains a key risk.
Vietnam Furniture Export Growth Slows
Vietnam’s furniture exports have expanded at a rapid pace over the past decade. Total exports rose from about 5.0 billion US dollars in 2015 to 13.3 billion US dollars in 2025, equal to a compound annual growth rate of 10.2%. This confirms the structural shift already discussed in our earlier Vietnam analysis: furniture has become a strongly export-driven industry, with external demand rather than domestic consumption shaping much of the sector’s growth path.
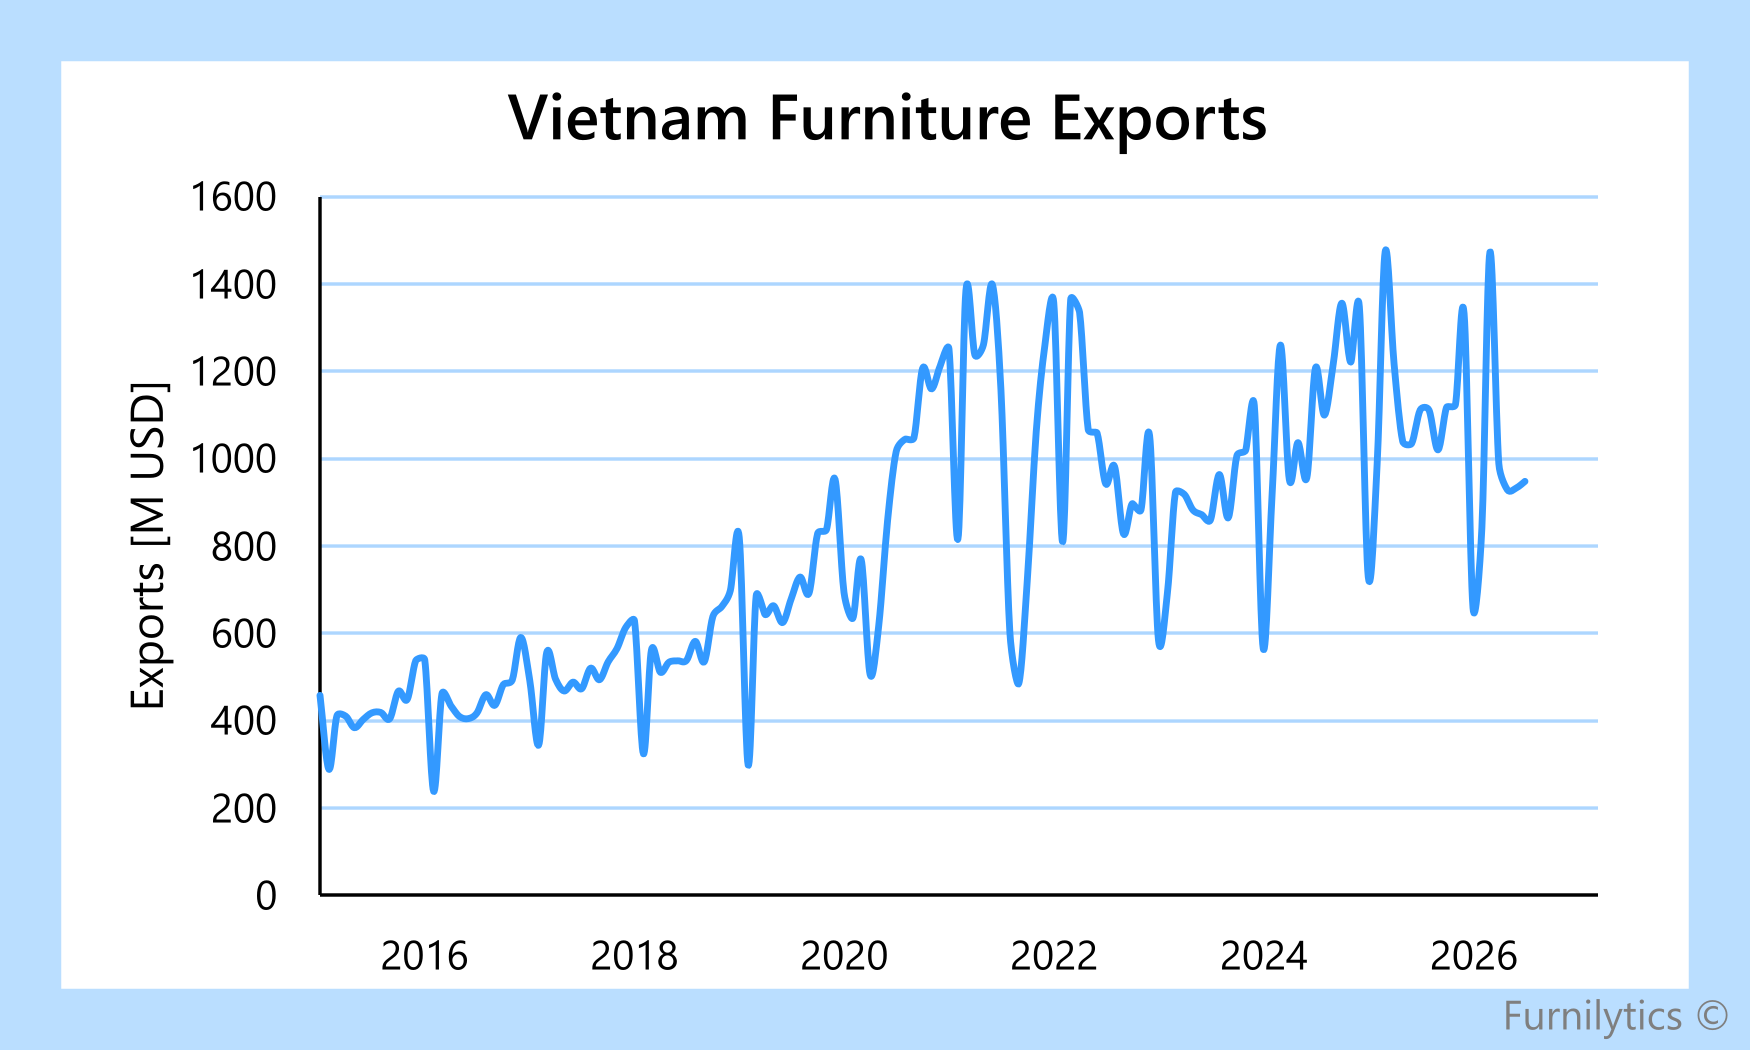
The latest data, however, shows that this expansion phase has cooled. In January-July 2026, Vietnam’s reported and bridged furniture exports reached about 6.8 billion US dollars, down 10.6% compared with the same period in 2025. This softer trend comes at a time when the US furniture market is also becoming less supportive for import-led growth, with weaker import demand, rising tariff pressure and a modest increase in local production reducing the pull from Vietnam’s most important end market.
The recent weakness should therefore be read as a loss of momentum from an elevated base, not a reversal of Vietnam’s long-term export position. Vietnam remains deeply embedded in global furniture supply chains, but the growth environment has become more demanding.
Diversification Has Not Offset the US Slowdown
The slowdown in Vietnam’s furniture exports is visible across the main destination groups, but the intensity differs by region. In January-July 2026, total exports reached about 6.8 billion US dollars, down 10.6% year on year. The US remained by far the largest destination, with exports of about 5.5 billion US dollars, but also declined by 10.2%. This means that most of the absolute export base is still tied to a market that is currently under pressure from softer import demand and higher tariff exposure.
The EU performed better in relative terms, with exports down only 3.1% year on year, but the base was much smaller at around 0.1 billion US dollars. Other markets accounted for about 1.2 billion US dollars and declined by 12.6%, making them the weakest group in the year-to-date comparison. The regional split therefore shows that Vietnam’s recent slowdown is not only a US-specific issue, even though the US dominates the overall level.
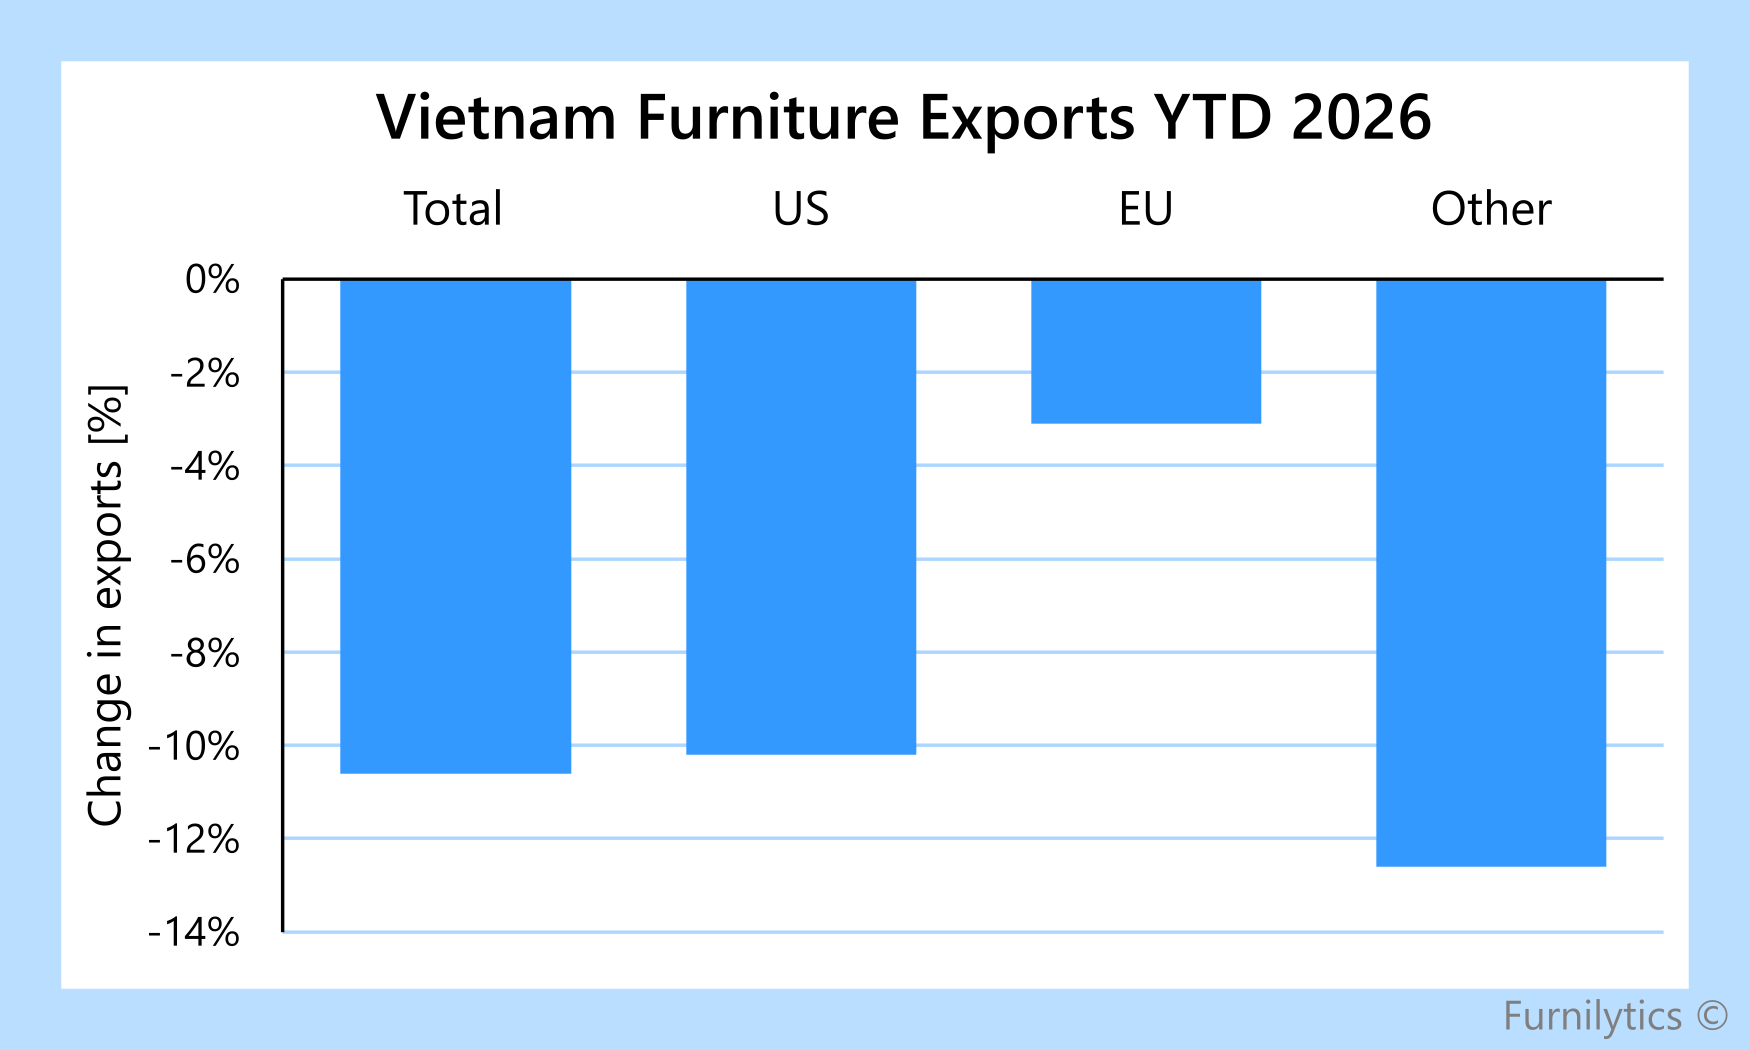
This matters for diversification. Vietnam’s non-US markets are important, but they are not yet large or strong enough to offset a weaker US cycle. The EU is relatively more stable but small, while other markets are larger than the EU but currently declining faster. For Vietnamese exporters, diversification remains a strategic priority, but the latest year-to-date data suggests that the export model is still highly exposed to conditions in the US market.
The US Remains the Anchor Market
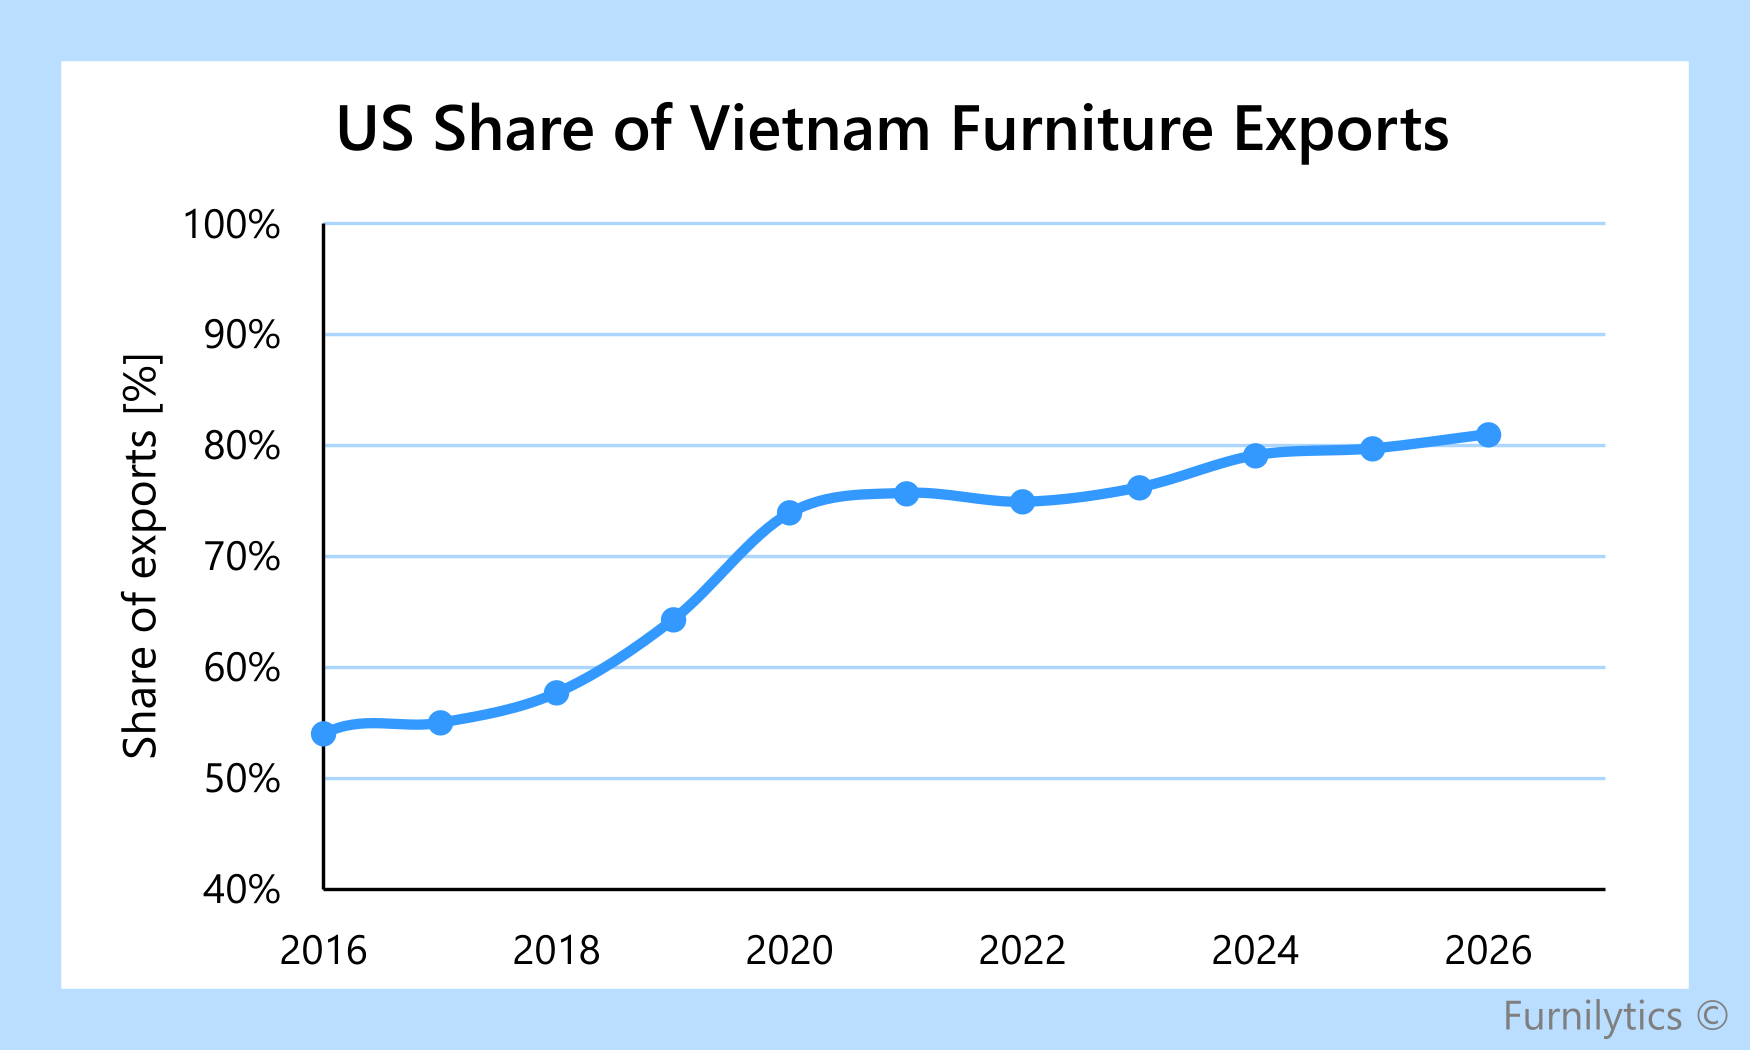
The US remains the central market for Vietnam’s furniture exports. Its share rose from about 54% in 2016 to around 81% in January-July 2026, showing how strongly Vietnam’s export growth has become tied to one destination. This concentration makes changes in US demand, tariffs and sourcing strategy especially important for Vietnamese manufacturers.
US import data adds nuance. Vietnam supplied about one quarter of US furniture imports in January-July 2026, broadly unchanged from the same period in 2025. However, the US furniture market became less import-dependent overall: imports fell from about 38% of apparent consumption to about 35%, as imports declined while domestic production edged higher. This suggests that Vietnam remains a key US import supplier, but the current slowdown is also linked to a weaker US import cycle rather than a major loss of sourcing position.
Conclusion
Vietnam’s furniture export sector remains structurally strong, but the latest data points to a more difficult growth phase. Exports have more than doubled since 2015, yet year-to-date 2026 exports are below last year’s level and momentum has softened across key destination groups.
The main vulnerability is concentration. The US still absorbs the majority of Vietnam’s furniture exports, while non-US markets are not yet large enough to offset a weaker US cycle. With the US market also becoming less import-dependent, Vietnam remains a critical supplier but faces a less supportive demand environment.
For Vietnamese manufacturers, the next phase is likely to depend less on rapid volume growth and more on resilience, competitiveness under tariff pressure, and gradual market diversification.
Sources:
Furnilytics Vietnam furniture exports monthly
Furnilytics Vietnam furniture exports to the US
Furnilytics Vietnam furniture exports to the EU
UN Comtrade international trade statistics
Eurostat Comext international trade statistics
US Census Bureau international trade data
European Central Bank exchange rates
Methodology & limitations:
The analysis uses Furnilytics monthly Vietnam furniture export data for HS 9401-9403 furniture products. Export values are shown in nominal US dollars. The export series combines Vietnam-reported trade data with a partner-reported trade bridge for the most recent period. The bridge uses importer-reported data from major destination markets, including the United States and European countries, and reconciles these observations with the historical Vietnam-reported export structure to maintain a consistent monthly trend. Total export coverage combines directly reported destination rows, bridged major partner markets and an other-destinations component.
The US-share chart compares US exports with total Vietnam furniture export coverage on the same basis. July is the latest month included in the main charts; later rows are excluded where destination coverage is still sparse. The YTD comparison uses the latest common year-to-date period for total exports, the United States, the European Union and other markets. “Other markets” includes tracked non-US/non-EU partner countries and the residual other-destinations bridge. The figures are intended to show export direction, market concentration and recent momentum, not to provide a final official estimate of full-year Vietnam furniture exports.
Compared with the previous Vietnam analysis, this update uses a broader Vietnam export-performance view rather than only the US trade/tariff lens, and applies a consistent partner-bridge approach for recent monthly totals.