
European Furniture Manufacturing: A Changing Workforce
Employment and productivity in the European furniture industry have changed considerably since 2018. Examining furniture production value alongside the manufacturing workforce helps assess how the sector’s performance has developed.
This analysis examines employment across 28 European countries, compares nominal and price-adjusted production value per worker, and explores regional differences, including developments in Poland, Germany and Italy. The aim is to assess whether higher production value has been accompanied by stronger output per worker and how Europe’s manufacturing workforce has changed.
A smaller workforce after the 2021 rebound
European furniture manufacturing employed an estimated 1.02 million people in 2025, around 52,000 fewer than in 2018. Across the 28 countries covered, this represents a decline of 4.9%. The longer-term picture is therefore one of a smaller manufacturing workforce, although the adjustment has not followed a continuous downward path.
Employment was broadly stable in 2018 and 2019 before falling in 2020. A strong rebound followed in 2021, taking employment to approximately 1.09 million, the highest level in the period. That increase was subsequently reversed. Employment declined for three consecutive years, reaching approximately 1.01 million in 2024. This was almost 74,000 fewer people than at the 2021 peak.
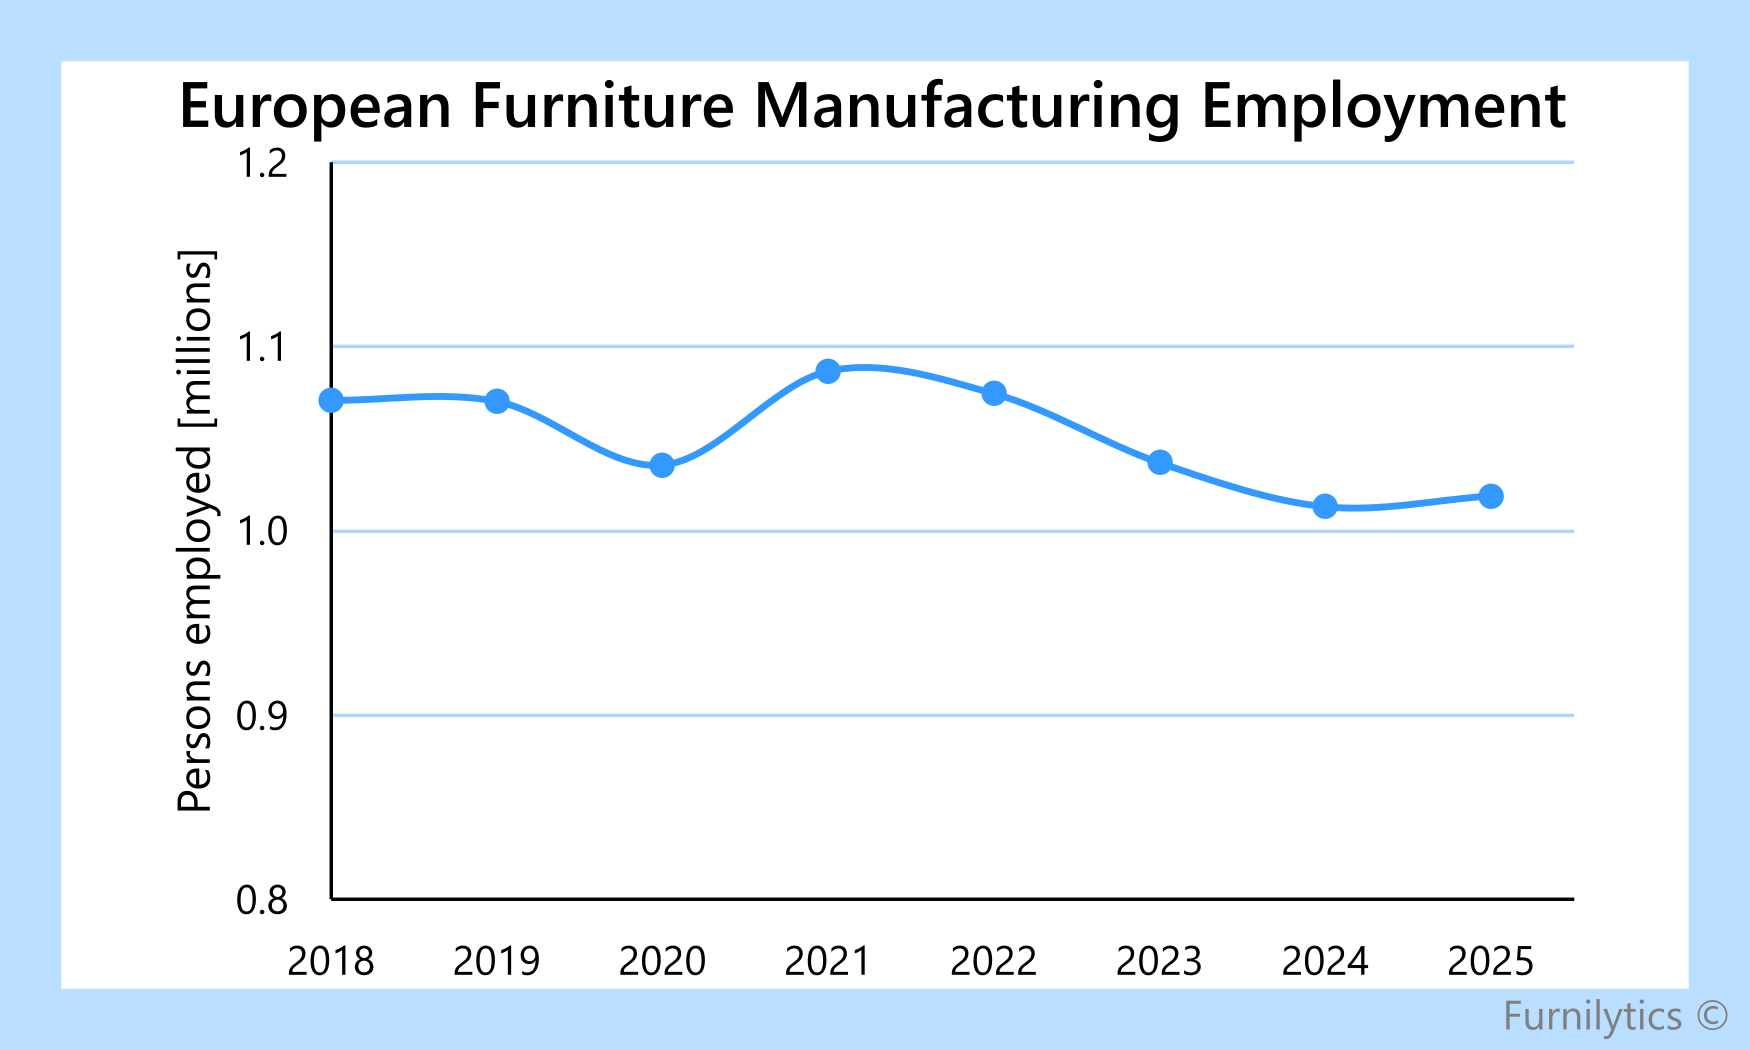
The 2025 estimate suggests some stabilisation. Employment increased by approximately 5,900 people, or 0.6%, compared with 2024. However, this modest increase leaves the workforce around 6.2% below its 2021 level. Much of the latest-year employment data is estimated, so the uptick provides an early indication of stabilisation rather than firm evidence of a sustained recovery.
European Furniture Productivity Stalls
Nominal production value per person employed increased from approximately 100,200 euro in 2018 to 122,200 euro in 2025, a rise of 22%. Across the same period, total nominal production value grew by 16.1%, while employment declined by 4.9%. Both developments contributed to the higher production value per worker.
Most of the increase occurred between 2020 and 2022, when nominal production value per person rose from approximately 97,200 euro to 121,200 euro. Since then, it has remained broadly unchanged. The smaller workforce has therefore not been accompanied by a sustained increase in production value per person in recent years.
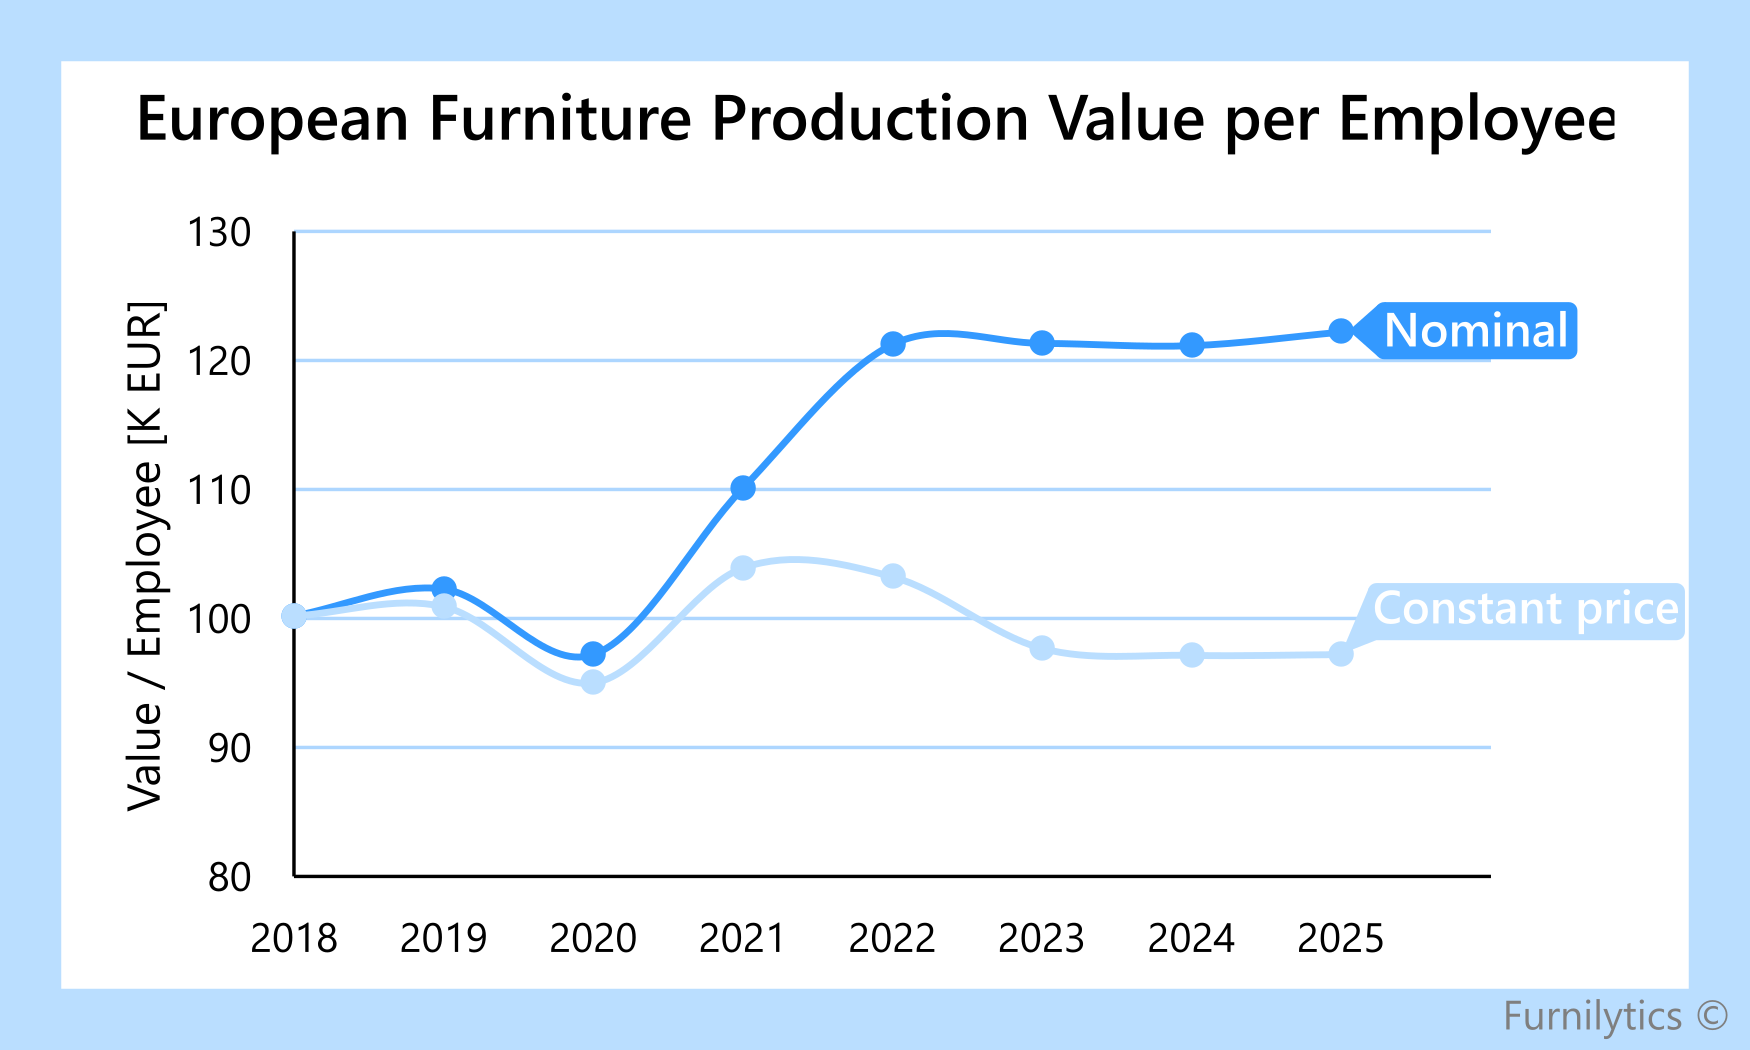
The constant-price series shows a similar loss of momentum. Real production value per person peaked at approximately 110,100 euro in 2021 before declining to around 103,000 euro in 2025. This was approximately 3% below its 2018 level. Between 2021 and 2025, real production fell by 12.3%, exceeding the 6.2% reduction in employment.
The recent employment adjustment has therefore accompanied a larger contraction in price-adjusted production. Despite operating with fewer people, the European furniture industry has yet to show a sustained recovery in aggregate output per worker. For a complementary view of productivity, see our analysis of European furniture productivity and labour-cost efficiency, which examines value added per worker and its relationship with personnel costs.
Regional Trends in Furniture Employment
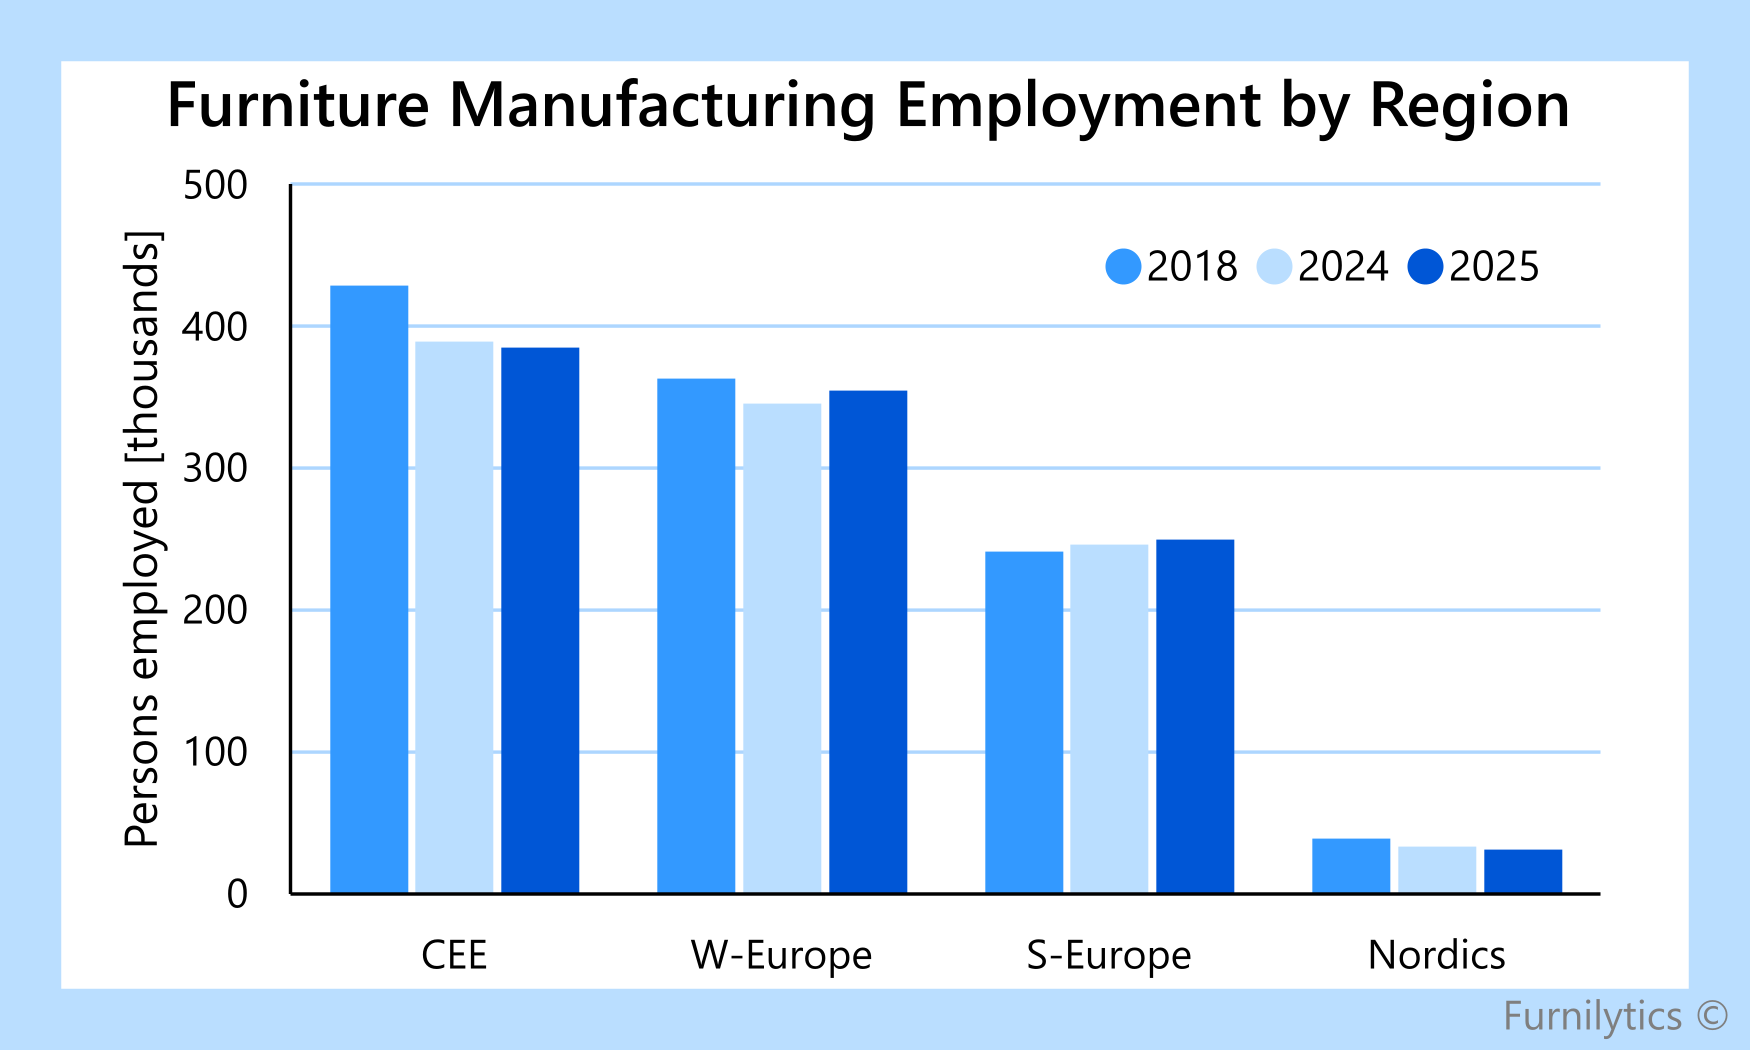
Employment developments differ considerably across Europe’s furniture manufacturing regions. Central & Eastern Europe remains the largest employment base, with approximately 385,000 people employed in 2025. However, its workforce contracted by around 10% since 2018, accounting for most of the European employment reduction.
Western Europe recorded a more modest decline of approximately 2%, while Southern Europe’s workforce grew by around 3%. The Nordics experienced the sharpest proportional contraction, losing approximately one in five furniture manufacturing jobs over the period.
Poland, Germany and Italy together account for approximately 46% of European furniture manufacturing employment. Developments in these three markets therefore strongly influence the regional and European picture. Poland remains the largest employer, with approximately 187,000 people in 2025. Its workforce was around 9.5% smaller than in 2018, making it a substantial contributor to the reduction in Central & Eastern Europe . Germany follows with approximately 148,000 people, while Italy employs around 130,000.
Italy recorded a modest employment decline over the period, despite the broader resilience of Southern Europe. Germany’s latest estimate suggests an increase following its employment reduction through 2024, although this apparent rebound needs confirmation. The regional comparison therefore shows differing paths, with Southern Europe maintaining its overall employment base while Central & Eastern Europe and the Nordics experienced more substantial reductions.
Conclusion
European furniture manufacturing is operating with a smaller workforce than in 2018, while generating higher nominal production value per person employed. Most of that increase occurred before 2023. Since then, production value per worker has remained broadly stable, and price-adjusted output per worker has yet to regain its earlier peak.
The employment adjustment is uneven. CEE accounts for most of the absolute reduction, the Nordics have experienced the steepest proportional contraction, and Southern Europe has maintained a slightly larger workforce. Poland, Germany and Italy remain central to the European picture, together accounting for almost half of furniture manufacturing employment.
The modest estimated employment increase in 2025 suggests some stabilisation. A stronger recovery would require sustained production growth alongside improvements in output per worker. The latest figures provide an early indication of a more stable workforce, while evidence of renewed productivity growth remains limited.
Sources:
Eurostat Structural Business Statistics
Furnilytics European furniture production
Eurostat Labour Force Survey
Furnilytics European furniture enterprise structure
Methodology & limitations:
Production value and employment are primarily based on Eurostat Structural Business Statistics for NACE C31 furniture manufacturing, supplemented by national statistical sources and Furnilytics harmonisation. The analysis covers a fixed group of 28 European countries over 2018-2025, including Norway, Switzerland, Serbia and the UK, while excluding Cyprus, Luxembourg and Malta.
For 2025, production values include Furnilytics methodology. Employment combines available source observations with estimates extending earlier structural benchmarks using full-year furniture-sector Labour Force Survey movements where available. These estimates remain subject to survey uncertainty and revisions. Real production is expressed at 2021 prices; missing real values for Serbia, Slovenia, Slovakia and the UK are derived by deflating nominal production using complete annual country-specific furniture producer price indexes.
Regional and European totals are summed across the same countries before production value per person employed is calculated. Nominal values are in current euros and reflect price developments as well as activity. Price-adjusted ratios retain limitations from source coverage, exchange-rate movements and estimation. Employment measures persons rather than hours worked, so these ratios do not isolate changes in technical efficiency.