
European Furniture Productivity and Labour Cost Efficiency
European furniture manufacturing has become more productive, but rising labour costs are changing how that productivity translates into competitiveness.
This analysis looks at labour productivity in the European furniture industry using gross value added per employee and wage-adjusted productivity. It examines how productivity and personnel costs have developed since 2015, compares major European regions and selected markets in 2025, and shows how labour-cost efficiency has shifted since 2018.
The results highlight an increasingly uneven picture: high productivity does not always mean high labour efficiency, while some traditional low-cost advantages are weakening.
Productivity and labour efficiency
Labour productivity shows how much value the furniture industry creates per employee. It is measured as gross value added divided by employment. Gross value added is the value created after subtracting purchased inputs such as materials, components, energy, logistics and external services. Importantly, employee costs are not deducted at this stage. A high GVA per employee therefore indicates strong value creation, but not necessarily low labour cost.
That is why wage-adjusted productivity is useful alongside it. This compares gross value added with personnel costs and shows how much value is generated for every euro spent on employees. Looking at both measures gives a more complete view: one shows how much value each employee creates, while the other shows how efficiently that value is created relative to labour cost.
Higher productivity, higher labour costs
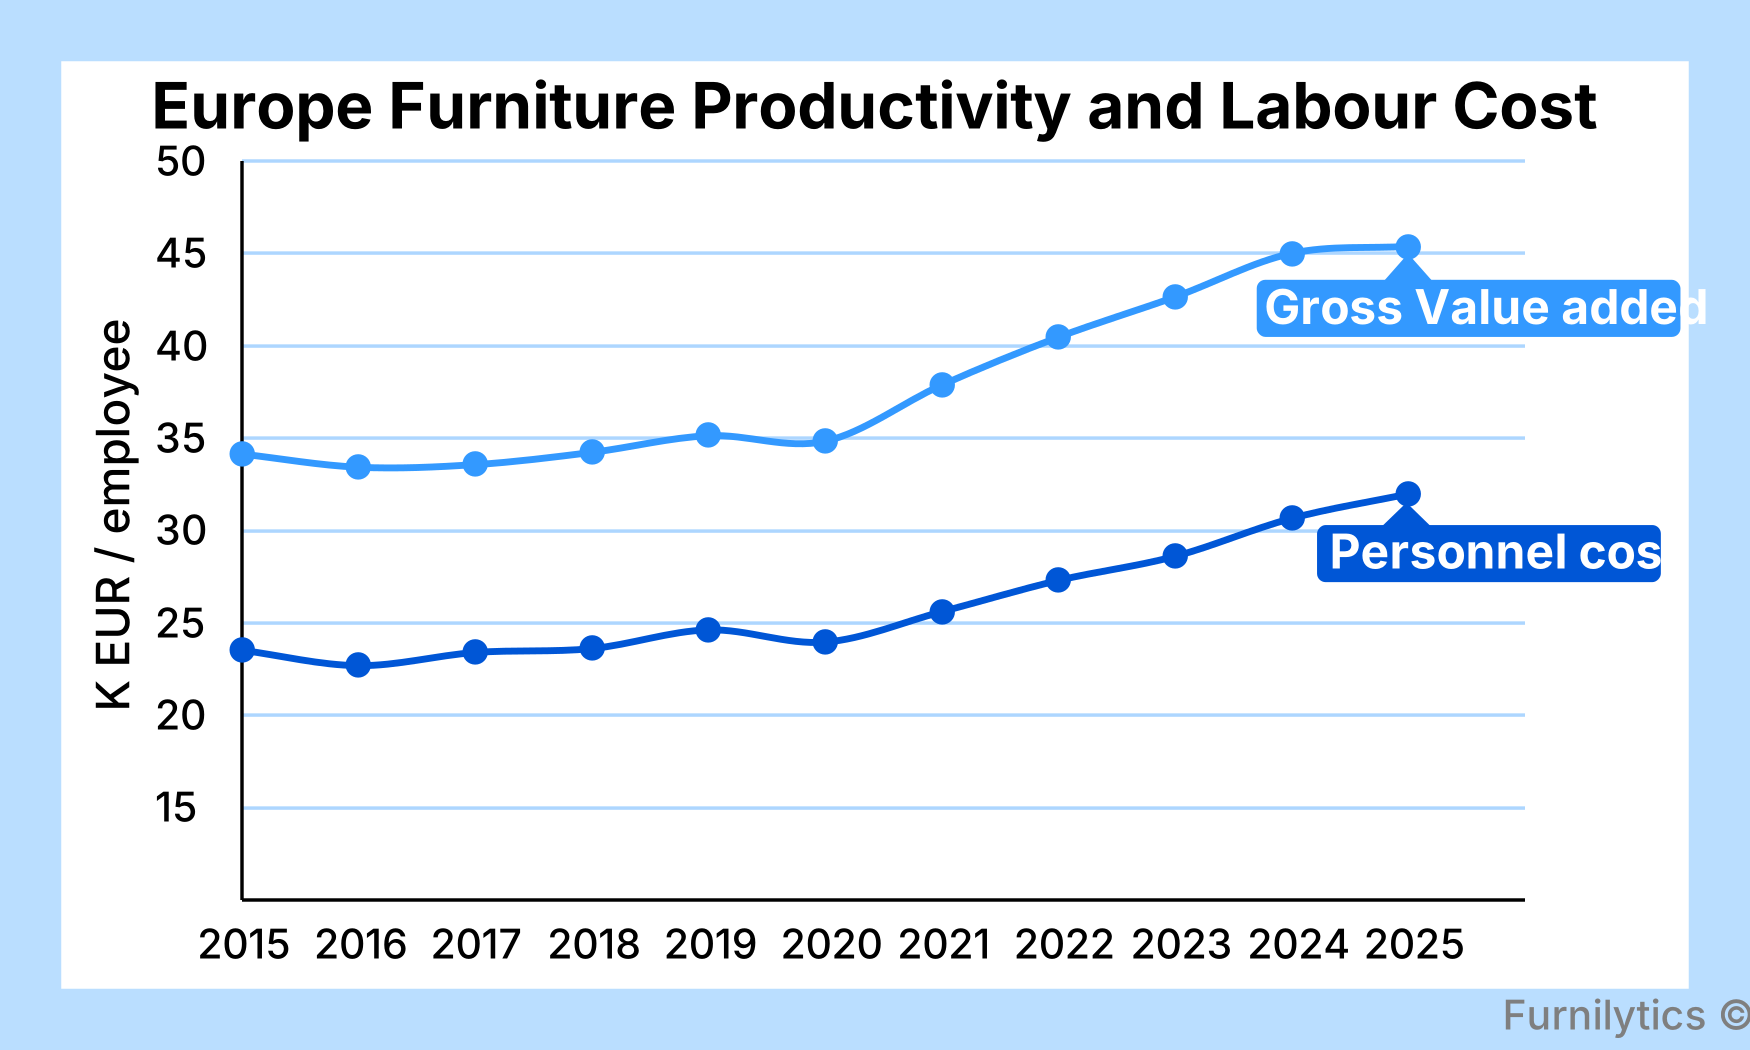
European furniture manufacturing is generating substantially more value per employee than several years ago. Gross value added per employee increased from €34.3k in 2018 to €45.4k in 2025, an increase of 32.4%. The improvement accelerated after 2020. GVA per employee rose from €34.9k in 2020 to €42.6k in 2023 and almost €45.0k in 2024, before growth slowed in 2025.
Personnel costs, however, increased at a similar pace. Average personnel cost per employee rose from €23.6k in 2018 to €32.0k in 2025, an increase of around 35%. As a result, higher value creation per employee has not translated into a stronger cost position. Wage-adjusted productivity illustrates this clearly. In 2018, European furniture manufacturers generated around €1.45 of gross value added for every €1 spent on personnel costs. The ratio improved modestly to around €1.49 in 2023, but declined to €1.42 in 2025.
The underlying message is therefore more nuanced than the productivity trend alone suggests: the industry is creating more value per employee, but rising personnel costs have absorbed most of that gain.
Productivity and labour cost across Europe
The 2025 comparison shows large differences in how much value furniture manufacturing creates per employee across Europe. The Nordics lead in absolute terms at €75.9k GVA per employee, followed by Italy at €65.0k and DACH at €62.6k. At the other end, CEE averages €25.1k per employee, with Poland only slightly higher at €26.8k.
But the gap narrows considerably once personnel costs are taken into account. High-productivity markets also tend to have high labour costs. In the Nordics, personnel cost reaches around €55.0k per employee, while DACH is close to €49.4k. This leaves their wage-adjusted productivity at 1.38 and 1.27 respectively.
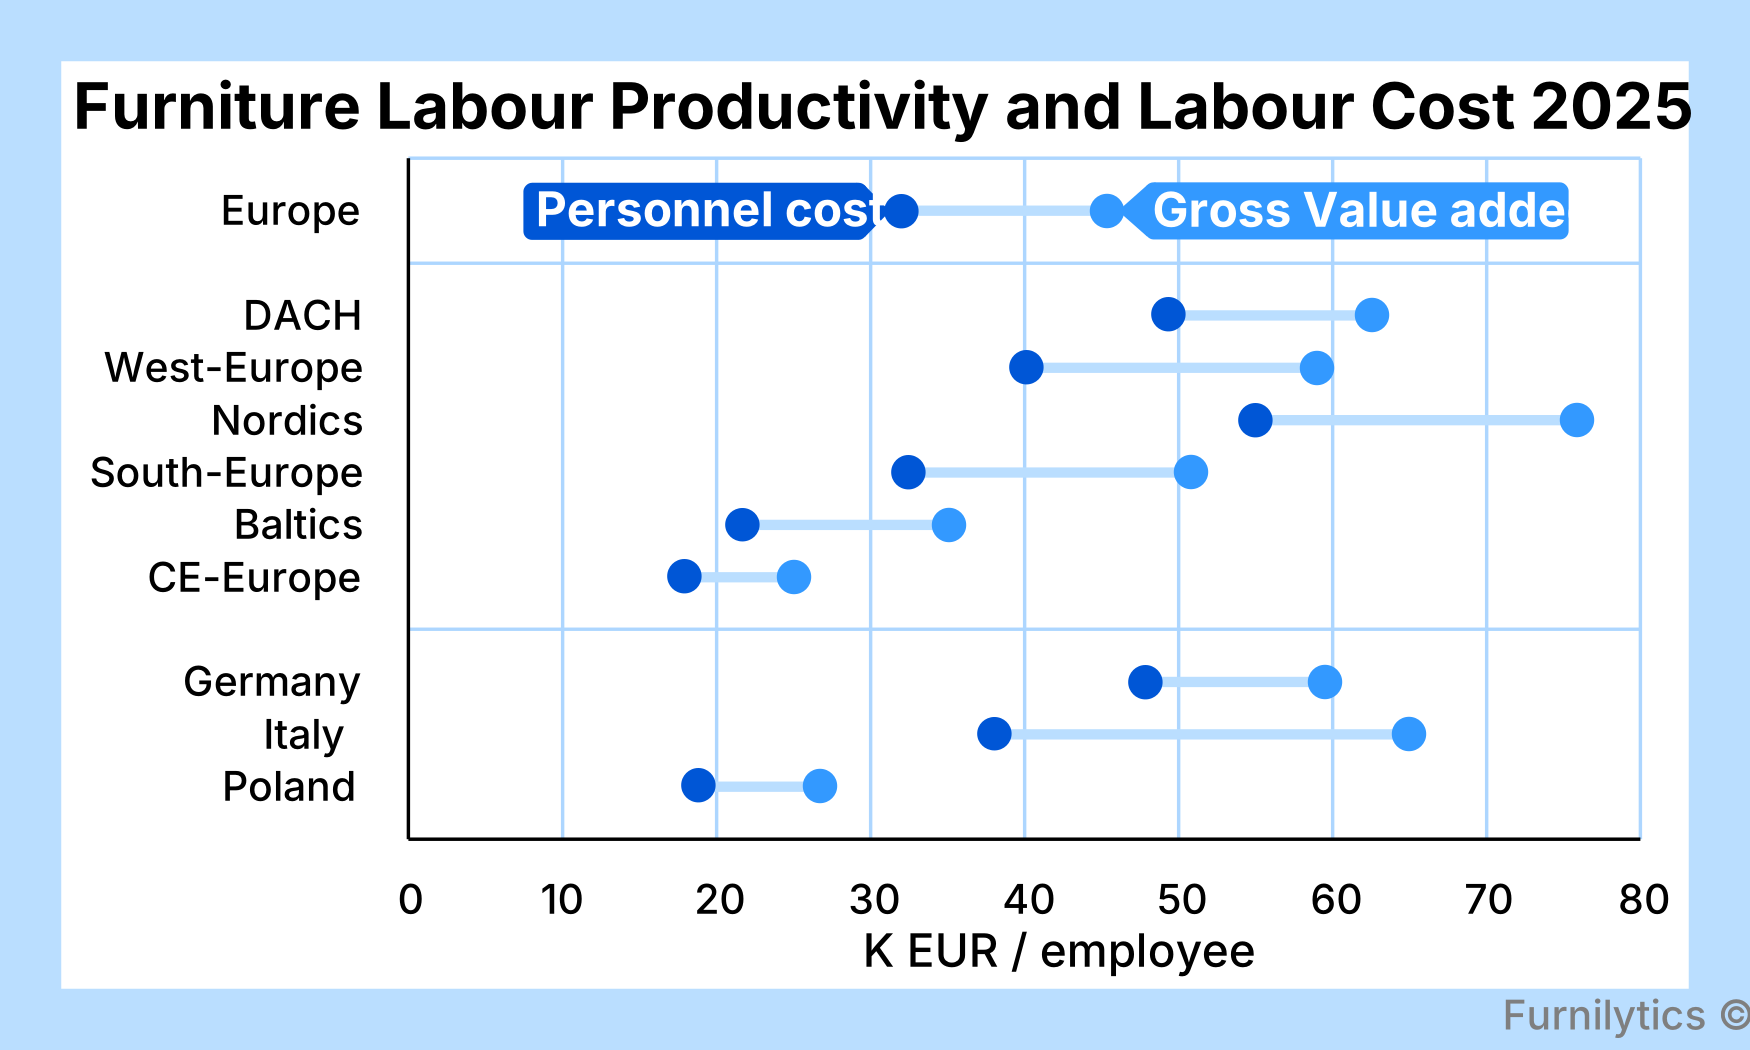
Italy stands out more strongly. With €65.0k GVA per employee and personnel costs of €38.1k, the sector generates around €1.71 of value added for every €1 spent on personnel. Southern Europe also performs relatively strongly at 1.56.
The Baltics show a different model. Absolute productivity remains below the European average, at €35.1k per employee, but relatively low personnel costs result in wage-adjusted productivity of 1.62, one of the highest in the comparison.
Germany illustrates the opposite. GVA per employee remains high at almost €60k, but personnel costs of nearly €48k per employee reduce wage-adjusted productivity to 1.25. The comparison therefore shows why absolute productivity alone gives only part of the picture: high value creation per employee does not necessarily translate into high value creation relative to labour cost.
The labour-cost advantage is changing
The longer-term comparison shows that Europe’s furniture manufacturing regions are not following the same path. While average wage-adjusted productivity across Europe is around 2% below its 2018 level, the regional picture is much more uneven.
The Baltics have improved the most, with wage-adjusted productivity up around 13% since 2018. Italy also stands out, combining relatively high GVA per employee with a 10% improvement in wage-adjusted productivity. Southern Europe shows a more moderate gain of around 5%. By contrast, several major production regions have moved in the opposite direction. DACH and Central and Eastern Europe are both around 6% below 2018, while Germany is down around 9%.
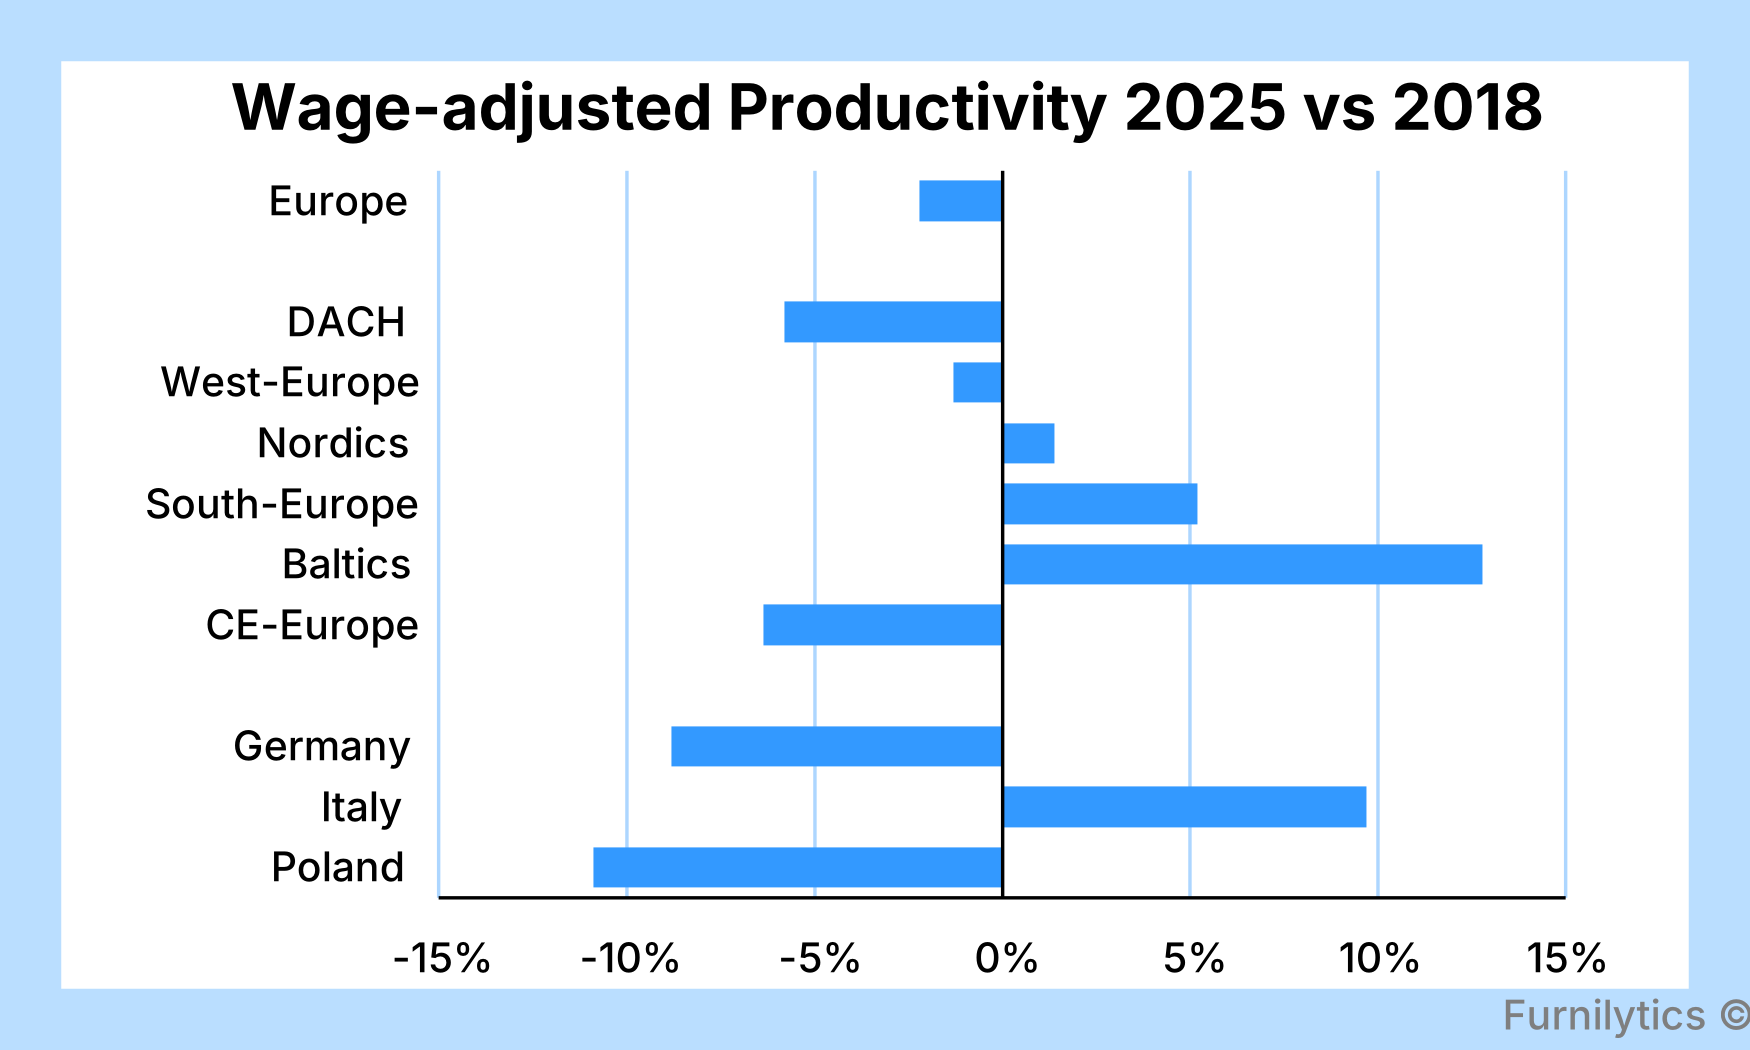
The largest decline among the selected markets is in Poland, where wage-adjusted productivity is around 11% lower than in 2018. Poland still generates roughly the same value per euro of personnel cost as the European average, but its relative labour-cost advantage has weakened considerably.
The divergence suggests that competitiveness is increasingly determined not just by how much value is created per employee, but by whether that value creation is keeping pace with rising labour costs. Italy and the Baltics have improved that balance; Germany, DACH and especially Poland have moved in the opposite direction.
Conclusion
European furniture manufacturing is creating substantially more value per employee than several years ago, but that improvement has not translated into stronger labour-cost efficiency across the board.
The regional picture is increasingly uneven. Italy and the Baltics combine relatively strong wage-adjusted productivity with improvement since 2018, while Germany, DACH and Poland have moved in the opposite direction. In Poland in particular, rising personnel costs have outpaced gains in value added per employee, weakening part of its traditional labour-cost advantage.
The broader implication is that competitiveness is becoming less about low wages alone and more about the ability to raise value creation at least as quickly as labour costs. Markets that can combine higher productivity with controlled personnel-cost growth are likely to strengthen their position; those where labour costs rise faster than value creation face increasing pressure on competitiveness.
Sources:
Eurostat Structural Business Statistics
Furnilytics European furniture production
Eurostat Labour Force Survey
Eurostat Labour Cost Index
Methodology & limitations:
Production value, gross value added, employment and personnel costs are primarily sourced from Eurostat Structural Business Statistics for NACE C31 furniture manufacturing. For Germany, Italy and Poland, 2024 values are official observed data. The 2024 Europe aggregate is also predominantly observed, with limited country-level gap filling.
For 2025, production value is taken from the Furnilytics furniture production nowcast. Employment is extended from the latest structural data using recent C31 employment developments. Gross value added is estimated using the latest observed GVA-to-production ratio. Personnel cost per employee is adjusted using recent wage growth, with broader manufacturing wage data used where furniture-specific data is unavailable.
Regional and European figures are calculated bottom-up from country totals before productivity ratios are calculated. Monetary values are in current euros, so changes over time reflect both underlying activity and price developments.