
Ukraine Furniture Industry: Growth, Resilience and Regional Position
Ukraine’s furniture industry has undergone substantial change over the past decade, shaped by rapid growth, repeated economic shocks and the effects of war. Despite these disruptions, the sector has retained a sizeable production and export base and has recovered strongly from the sharp decline recorded in 2022.
This analysis reviews the development of the Ukrainian furniture industry through production, exports, employment and enterprise data. It also compares Ukraine with selected regional peers to assess how the sector has developed in terms of production scale, growth and its wider economic and labour-market importance. The goal is to provide a data-driven view of how resilient the industry has been, how its structure has changed, and where Ukraine now stands within the wider European furniture manufacturing landscape.
Production and Export Recovery
Ukraine’s furniture industry has experienced two major periods of disruption over the past decade. The first followed the start of the war in 2014, when economic activity weakened and the country also faced substantial inflation and currency depreciation. Consumer-price inflation reached 48.7% in 2015, making nominal production values from this period particularly difficult to interpret in isolation.
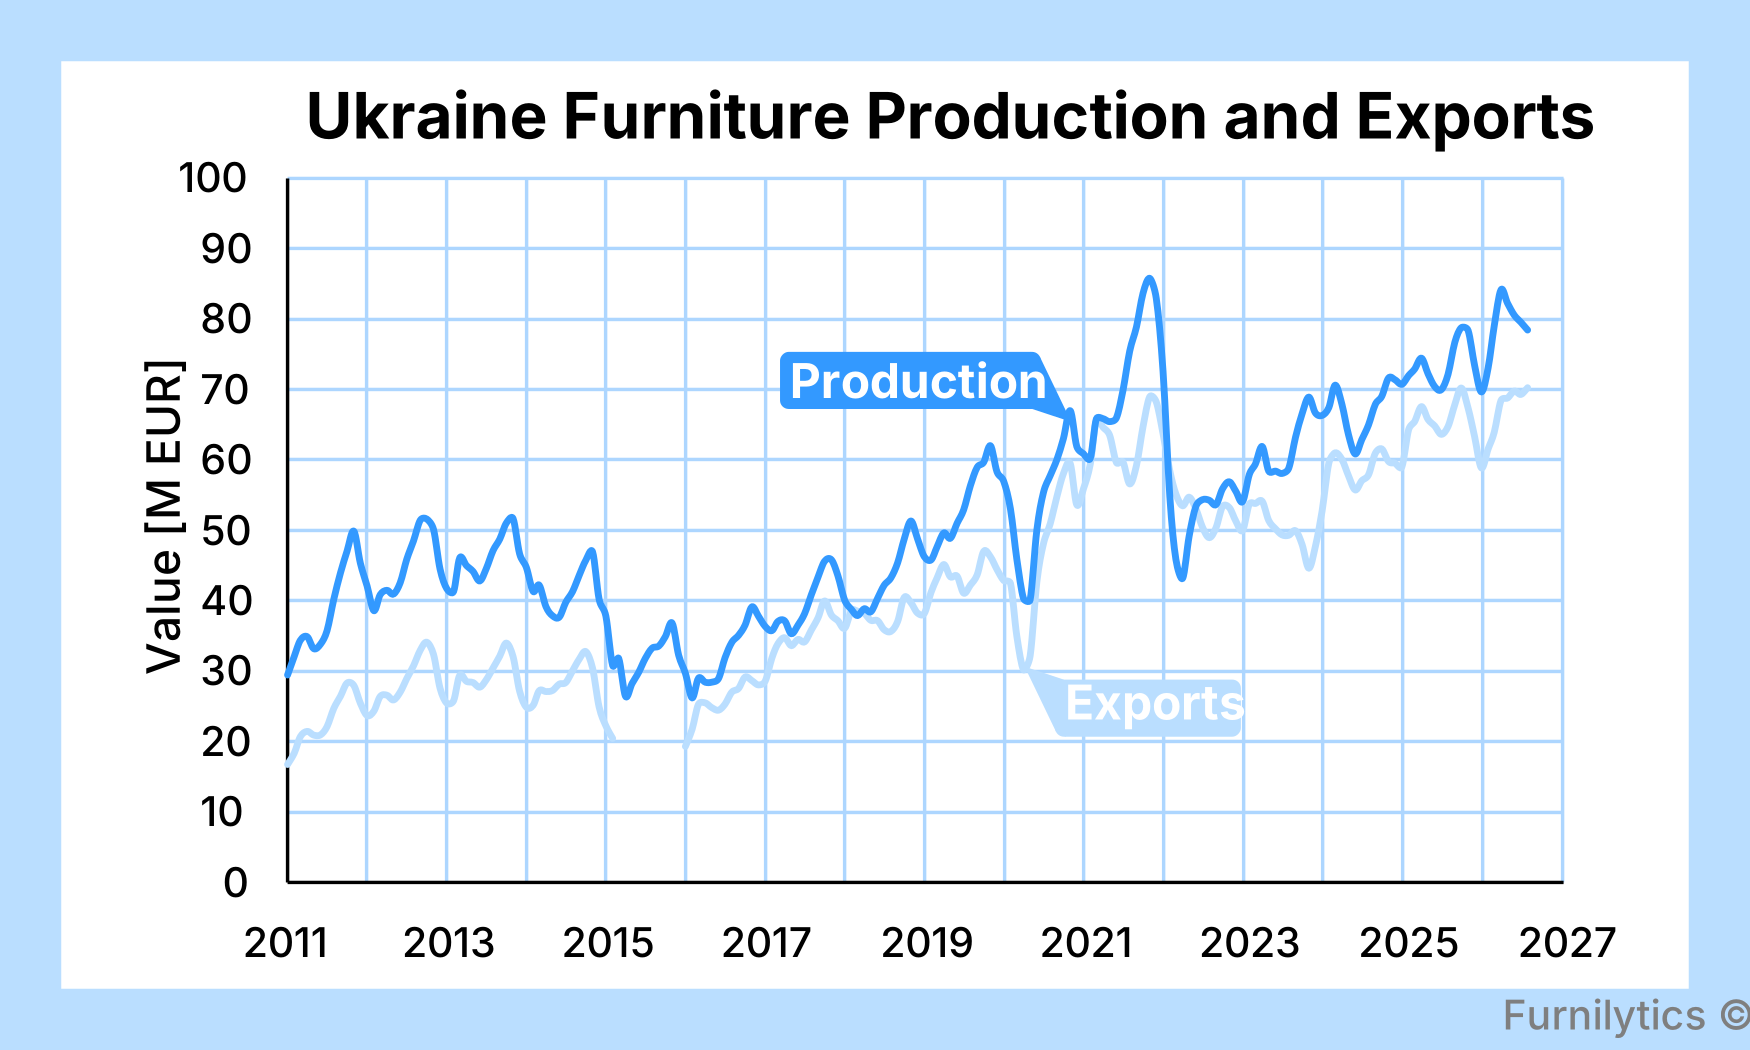
From around 2017, the sector entered a stronger growth phase. Furniture production increased steadily and reached approximately EUR 861 million in 2021, while exports also expanded. A much larger disruption followed in 2022, when the war renewed and expanded beyond the areas affected since 2014. Furniture production fell to EUR 646 million, a decline of roughly 25% in a single year, while exports also dropped sharply.
The recovery since then has been notable. Production increased to EUR 733 million in 2023, EUR 803 million in 2024 and an estimated EUR 884 million in 2025, slightly above the 2021 peak. Exports show a broadly similar recovery, underlining the sector’s strong export orientation and continued access to international markets. Despite the substantial 2022 shock, Ukraine retained a sizeable furniture manufacturing and export base.
Recovery With Fewer Workers and Firms
The recovery in production has not been matched by a similar recovery in the industry’s employment base. Furniture employment fell from around 40 thousand workers in 2021 to 29 thousand in 2024, a decline of roughly 26%. The number of enterprises also dropped from 1475 to 1200, although part of the initial 2022 decline has since been reversed.
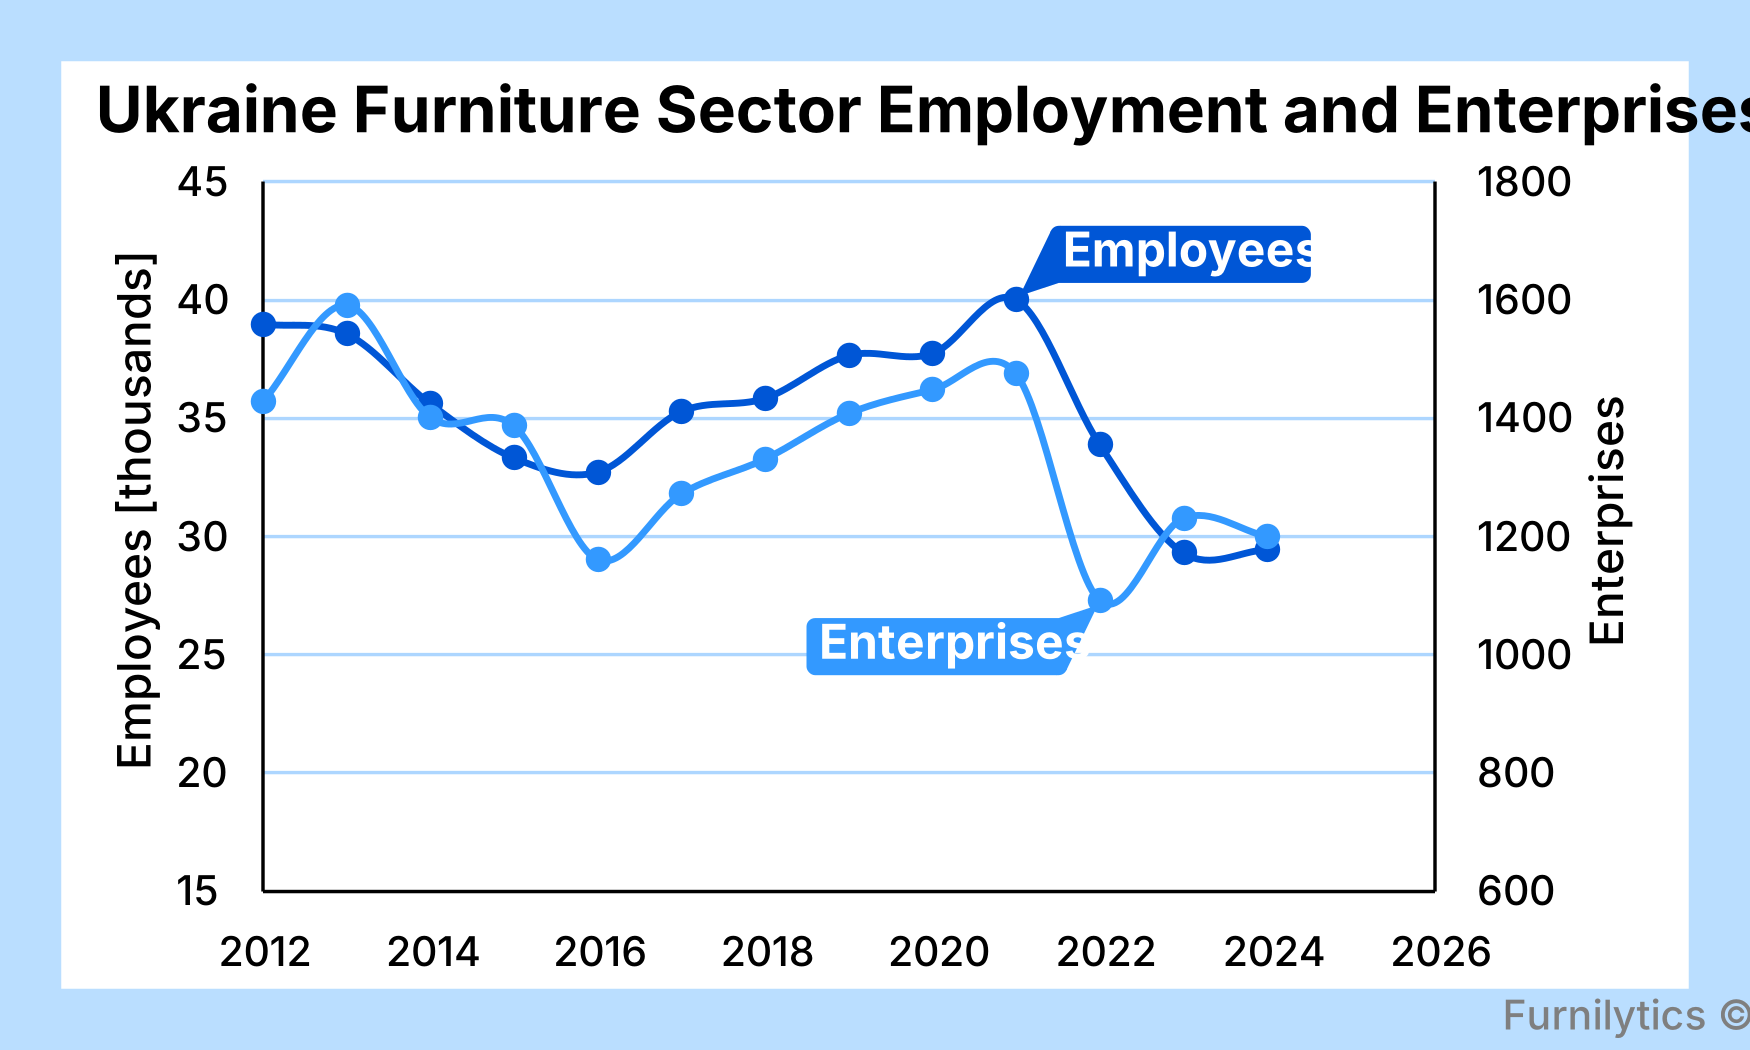
The longer-term social footprint has therefore weakened in absolute terms. Compared with 2013, the industry employs around 9,000 fewer people. However, Ukraine’s working-age population has also declined substantially, meaning furniture employment as a share of the working-age population changed only modestly, from 0.12% in 2013 to 0.11% in 2025.
At the same time, the sector’s economic footprint has held up comparatively well. Furniture production increased from around 0.40% of GDP in 2013 to 0.46% in 2025. This creates an important contrast: the industry now represents a similar or slightly larger share of economic activity, while supporting fewer direct jobs and operating through fewer enterprises. Taken together, the data point to a smaller employment base behind the production recovery. This may indicate a leaner and more concentrated industry structure, although nominal turnover growth should not automatically be interpreted as equivalent productivity growth.
Ukraine in Regional Context
Ukraine’s furniture industry is now similar in absolute size to several established regional producers. In 2025, production turnover reached around EUR 884 million, close to Serbia at EUR 864 million and Bulgaria at EUR 835 million, somewhat below Hungary at EUR 965 million, and well below Romania at EUR 3.19 billion.
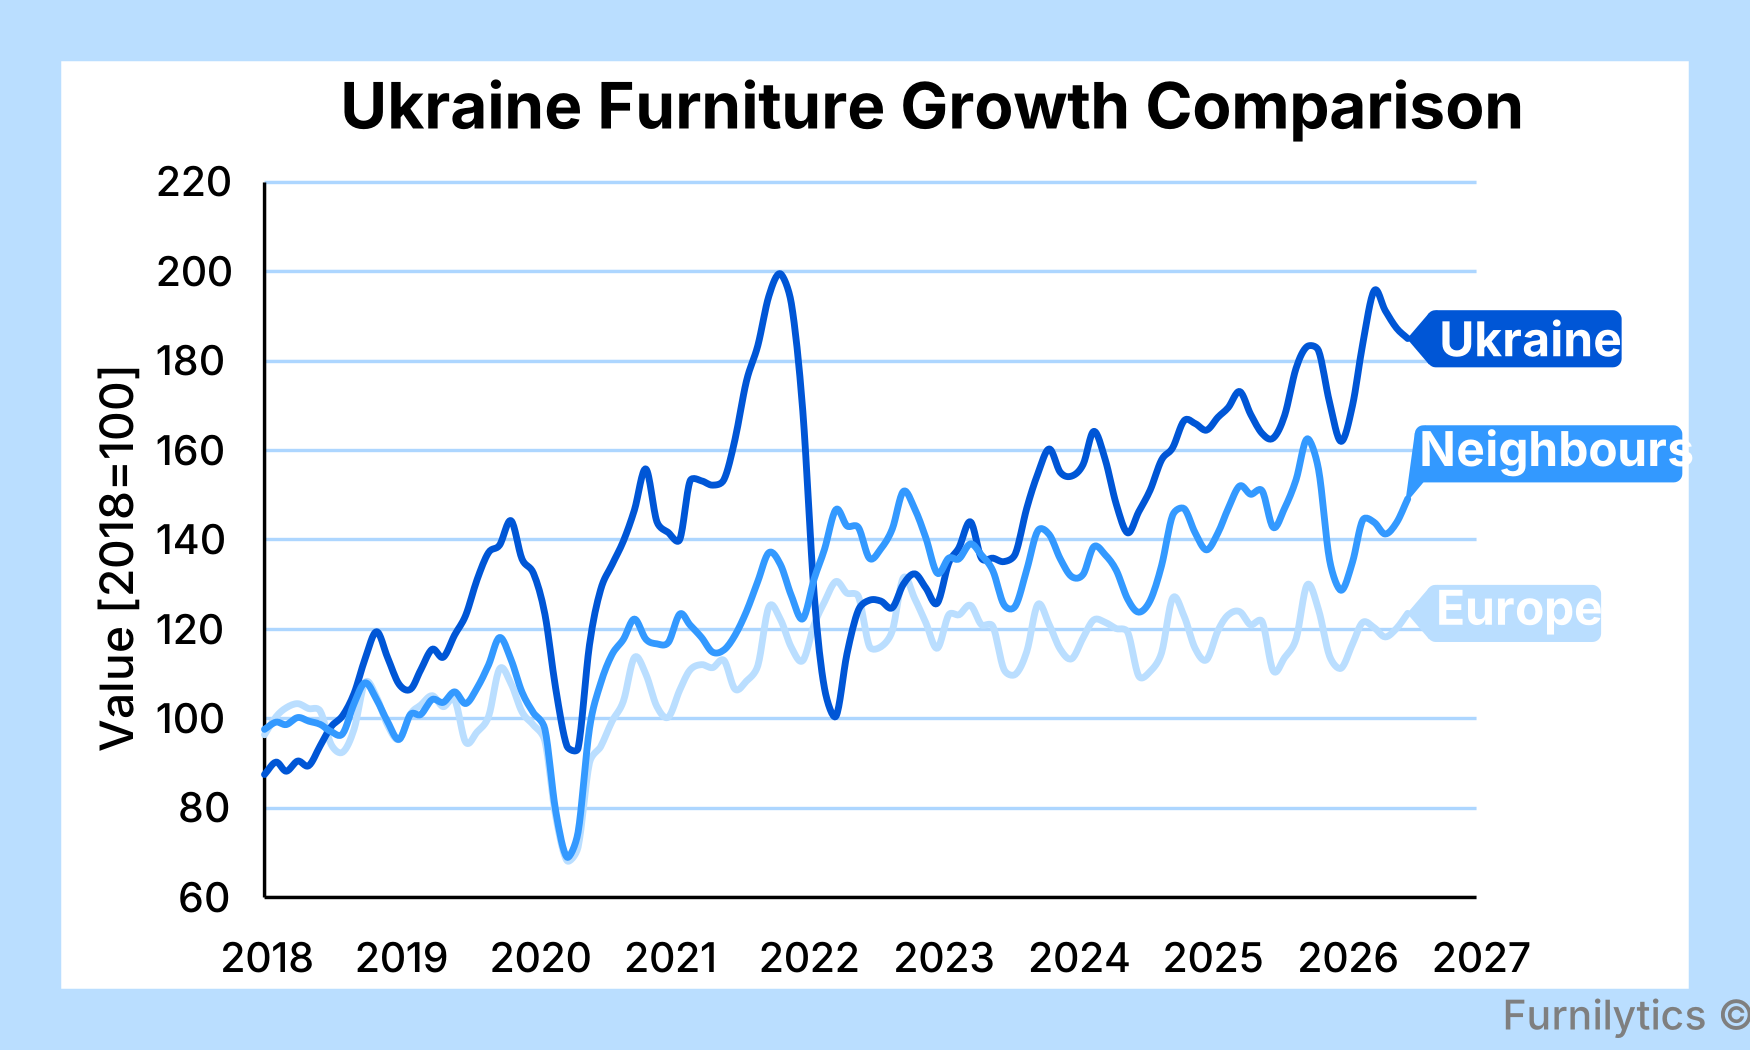
The longer-term growth picture is more distinctive. Between 2015 and 2025, Ukraine’s furniture production increased by approximately 128%. This was substantially faster than the wider European market at 42%, and also ahead of Romania at 68%, Bulgaria at 73% and Hungary at 49%. Among the selected peers, only Serbia grew faster, at around 182%.
Despite that growth, furniture manufacturing remains less important to Ukraine’s wider economy and labour market than in several peer countries. Production turnover represented around 0.46% of GDP in 2025, compared with 0.97% in Serbia, 0.84% in Romania and 0.72% in Bulgaria. Employment shows an even wider gap: furniture manufacturing accounted for around 0.11% of Ukraine’s working-age population, compared with 0.54% in Serbia, 0.47% in Bulgaria, 0.41% in Romania and 0.30% in Hungary.
Conclusion
Ukraine’s furniture industry has shown substantial resilience over the past decade. Production recovered from two major periods of disruption and reached an estimated EUR 884 million in 2025, slightly above the 2021 level. Over the longer term, production has grown strongly, increasing by around 128% since 2015, faster than most of the selected regional peers.
That recovery has not been matched by employment or enterprise growth. The sector now operates with fewer workers and fewer firms than before 2022, while its share of Ukraine’s working-age population remains relatively small compared with neighbouring furniture-producing countries. The ability to restore production despite this smaller industrial base underlines the sector’s resilience.
The overall picture is therefore one of a smaller but still sizeable and resilient industrial base, with strong long-term production growth and a continued export orientation. Ukraine has become more significant as a furniture producer in regional terms, even though the sector remains less central to the wider economy and labour market than in countries such as Serbia, Bulgaria and Romania.
Sources:
State Statistics Service of Ukraine - production and sale of industrial products
State Statistics Service of Ukraine - enterprise performance indicators
Furnilytics European furniture production
United Nations - Comtrade
State Customs Service of Ukraine trade indicators
Eurostat - GDP and main components
World Bank - working-age population
Methodology & limitations:
Ukraine production, employment and enterprise counts are based on Ukrstat C31 furniture-related industry and enterprise statistics. Peer-country production uses the Furnilytics European furniture production methodology, with 2025 values partly nowcast where final structural data is not yet available.
Exports cover furniture-related HS codes, mainly seats and parts, furniture and parts, mattresses and bedding, lamps and lighting fittings, and prefabricated buildings. Latest Ukraine export months are based on the Excel downloads provided by the State Customs Service of Ukraine. Where those files provide annual or year-to-date totals rather than full monthly HS6 detail, monthly values are estimated through temporal disaggregation.
GDP share is production turnover divided by nominal GDP in current euros. This is a gross turnover footprint, not a value-added contribution measure. Employment share is C31 employment divided by the population aged 15-64.