
European Furniture Industry Performance in Q3 2026
This analysis reviews European furniture market performance in Q3 2026 using the latest production and trade data available through September. It covers production turnover, real output, producer prices, apparent consumption and external trade to provide a broader view of recent market developments.
The figures cover 28 countries: 24 EU members, excluding Cyprus, Luxembourg and Malta, together with Norway, Switzerland, Serbia and the UK. The analysis looks beyond headline turnover to examine whether changes came from actual production or higher prices, and how imports, exports and differing national trends shaped the quarter.
European Furniture Performance in Q3
European furniture production remained under pressure in Q3 2026, although the nominal decline continued to moderate. Nominal production fell by 1.3% year over year to 29.2 billion euro, compared with declines of 2.4% in Q1 and 1.9% in Q2. Real production remained approximately 3.7% below the previous year throughout all three quarters.
| Metric | Q1 2026 YoY | Q2 2026 YoY | Q3 2026 YoY | Q3 level |
|---|---|---|---|---|
| Nominal production | −2.4% | −1.9% | −1.3% | EUR 29.2bn |
| Real production | −3.7% | −3.6% | −3.7% | |
| Production prices | +1.3% | +1.8% | +2.5% | Index 103.5 |
| Apparent consumption | −1.7% | +0.2% | +1.7% | EUR 32.2bn |
Production prices increased by 2.5% in Q3, partly supporting nominal turnover. This effect is examined in more detail later. Apparent consumption increased by 1.7%, supported by a 14.6% rise in external imports.
Performance among the largest manufacturing countries was uneven. Italy recorded Q3 production of approximately 6.25 billion euro, broadly unchanged from the previous year. Germany declined by 4.6% to 4.86 billion euro, while Poland fell by 4.0% to 3.29 billion euro. Together, these three countries represented almost half of the region’s nominal production during the quarter.
The quarterly measurements therefore point to gradual stabilization in nominal production value, but not yet to a broad production recovery. Market size, measured by apparent consumption, expanded slightly as stronger imports supported supply. At the same time, real output and several major manufacturing markets remained weak.
Production Turnover in Q3
European furniture production turnover continued to follow a clear seasonal pattern. Output values were relatively strong during the first half of each year, followed by a recurring decline in Q3 as summer shutdowns and lower August activity affected production.
Nominal production reached 29.2 billion euro in Q3 2026, compared with 29.6 billion euro one year earlier. The year-over-year decline narrowed from 2.4% in Q1 to 1.9% in Q2 and 1.3% in Q3. Production was also approximately 1.5% higher than in Q3 2024.
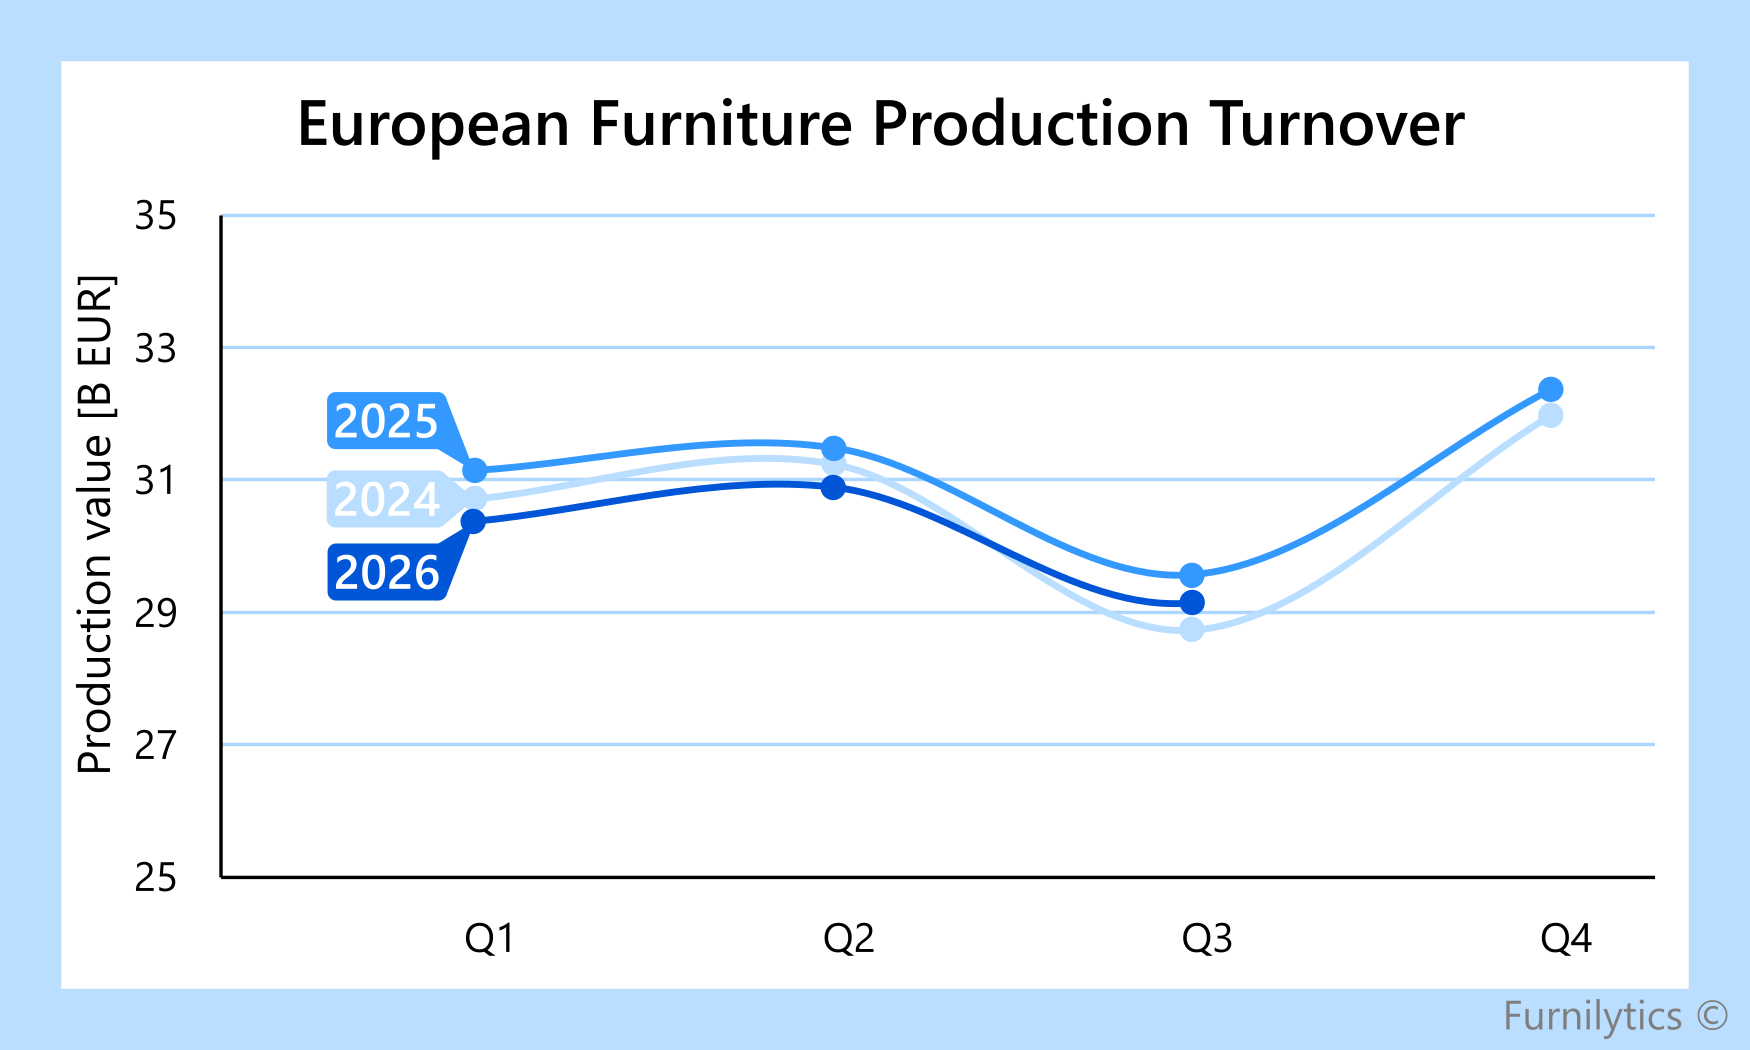
The figures suggest that European production turnover was moving closer to stabilization, although it had not yet returned to sustained growth. Previous years recorded a strong rebound in Q4, but no equivalent comparison is available for 2026 because the latest data cover only the period through September. Part of the recent stabilization may also reflect higher selling prices rather than an increase in the amount of furniture produced.
Prices Support Production Value
European furniture production prices were broadly stable during 2024 before beginning to rise in 2025. The increase accelerated during 2026, with year-over-year price growth moving from 1.3% in Q1 to 1.8% in Q2 and 2.5% in Q3. By Q3 2026, the price index stood 3.5% above its Q1 2024 level.
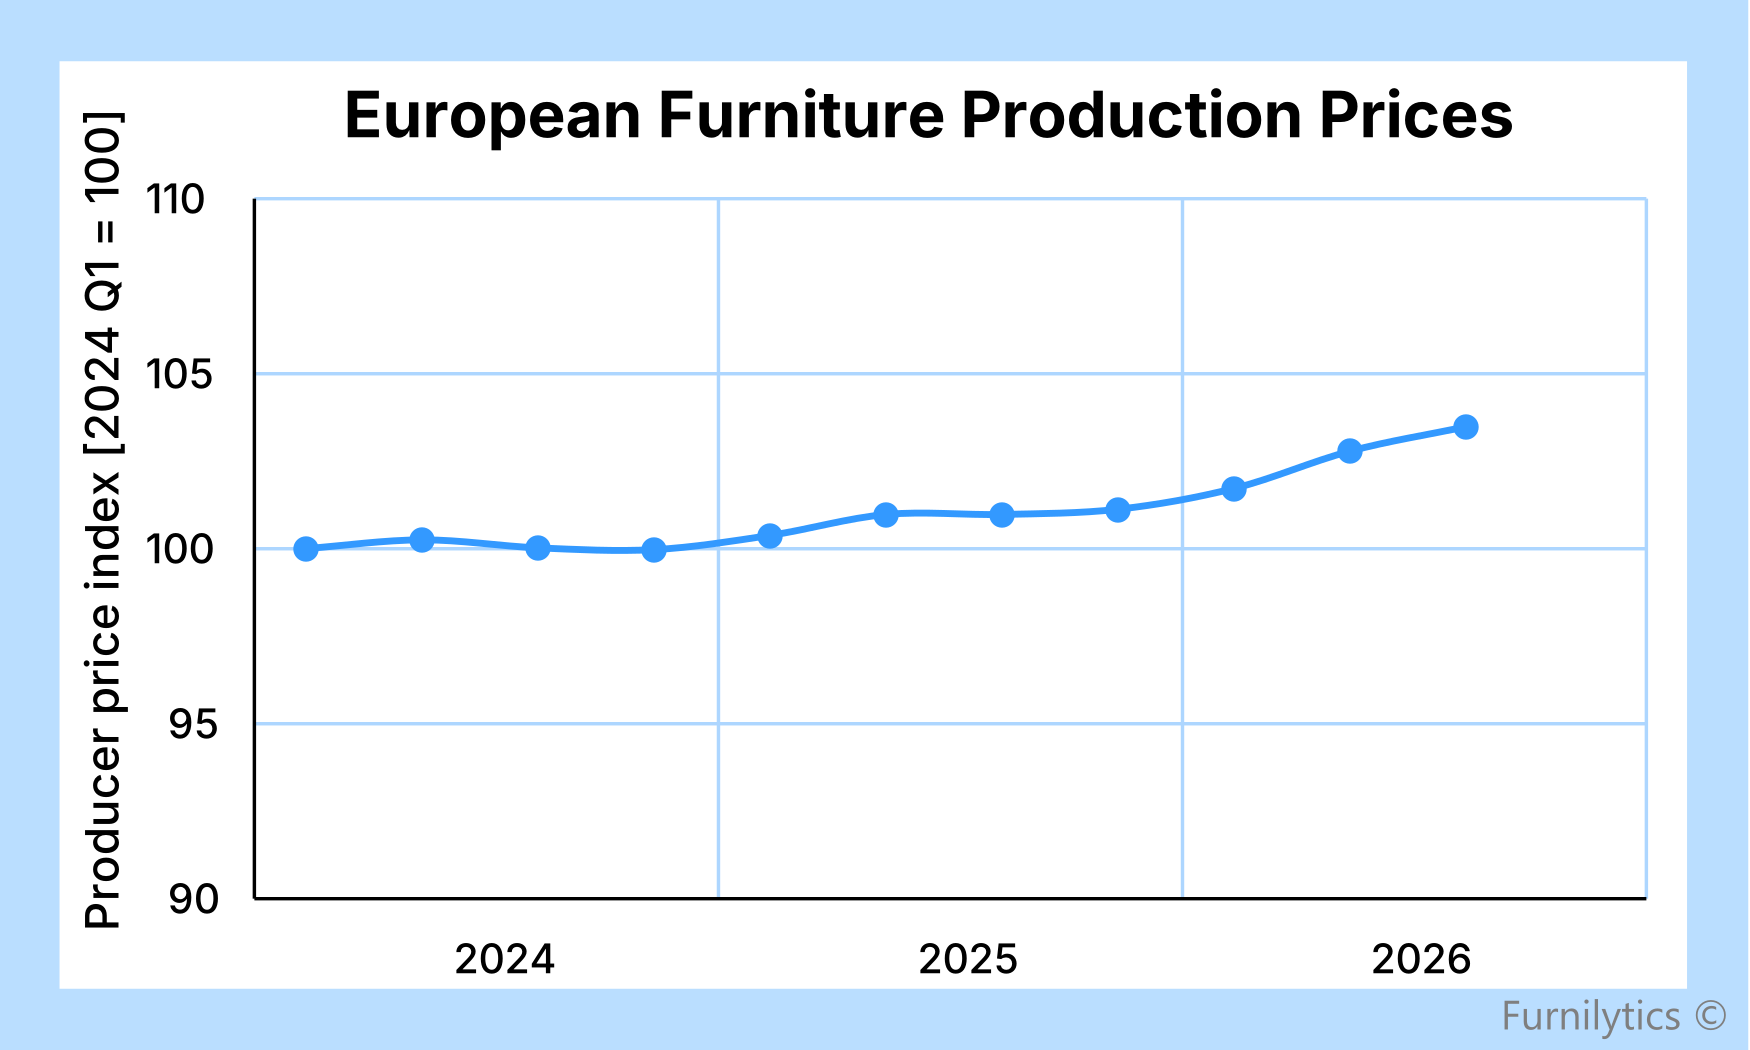
Manufacturers continued to face higher costs for wood-based panels, chemicals, energy, logistics and labour. These pressures appear to have contributed to higher selling prices even as demand remained subdued. This helps explain why turnover appeared more resilient than production activity. Nominal production declined by 1.3% year over year in Q3, while real production fell by approximately 3.7%. Higher selling prices offset part of the reduction in output, but did not indicate a recovery in the amount of furniture produced.
Performance Trends Remain Uneven
Trade trends are increasingly deviating from production trends in several markets. This may reflect changes in domestic sales, inventories, re-exports or the timing of deliveries rather than an immediate change in underlying activity.
As an example, Lithuanian production increased by 11.4% in Q3, while exports rose by only 1.5%. Official releases support the stronger production readings, but do not yet explain the trade divergence. Later quarters should show whether exports adjust to the higher production levels.
Conclusion
Q3 2026 combined a smaller decline in nominal production with slight growth in apparent consumption. Real production remained below the previous year, while higher production prices supported turnover and imports increased strongly. Developments also varied across countries, with production and trade indicators not always moving in the same direction.
The outlook depends on whether modest market growth begins to support European manufacturing more directly. Upcoming quarters will show whether real production improves, import growth moderates and export performance moves back into line with production trends.
Sources:
Eurostat Structural Business Statistics
Eurostat Short-term Business Statistics
Furnilytics European furniture production
Eurostat Comext and UN Comtrade
Methodology & limitations:
Production covers NACE C31 furniture manufacturing and combines Eurostat structural and monthly indicators with national sources and Furnilytics harmonisation. The fixed panel includes 24 EU countries, excluding Cyprus, Luxembourg and Malta, plus Norway, Switzerland, Serbia and the UK.
Nominal production is measured in current euros and real production at 2021 prices. The price index is derived from nominal and real production and rebased to Q1 2024 Quarterly changes are compared with the corresponding quarter one year earlier.
Trade covers HS 9401, 9402 and 9403. External trade excludes transactions within the 28-country panel. Results remain subject to source revisions, exchange-rate movements and estimation uncertainty.