
The Interconnected European Furniture Market
Europe’s furniture market is highly integrated and remains relatively self-sufficient at regional level, with production still close in size to apparent consumption. At the same time, manufacturing capacity is distributed unevenly across countries, making cross-border trade essential.
This analysis looks at how self-sufficient Europe is overall, where furniture production is concentrated, and where countries source their imports. The goal is to show how strongly national markets depend on one another and how much of that dependence remains within Europe rather than on external suppliers.
European furniture production relative to consumption
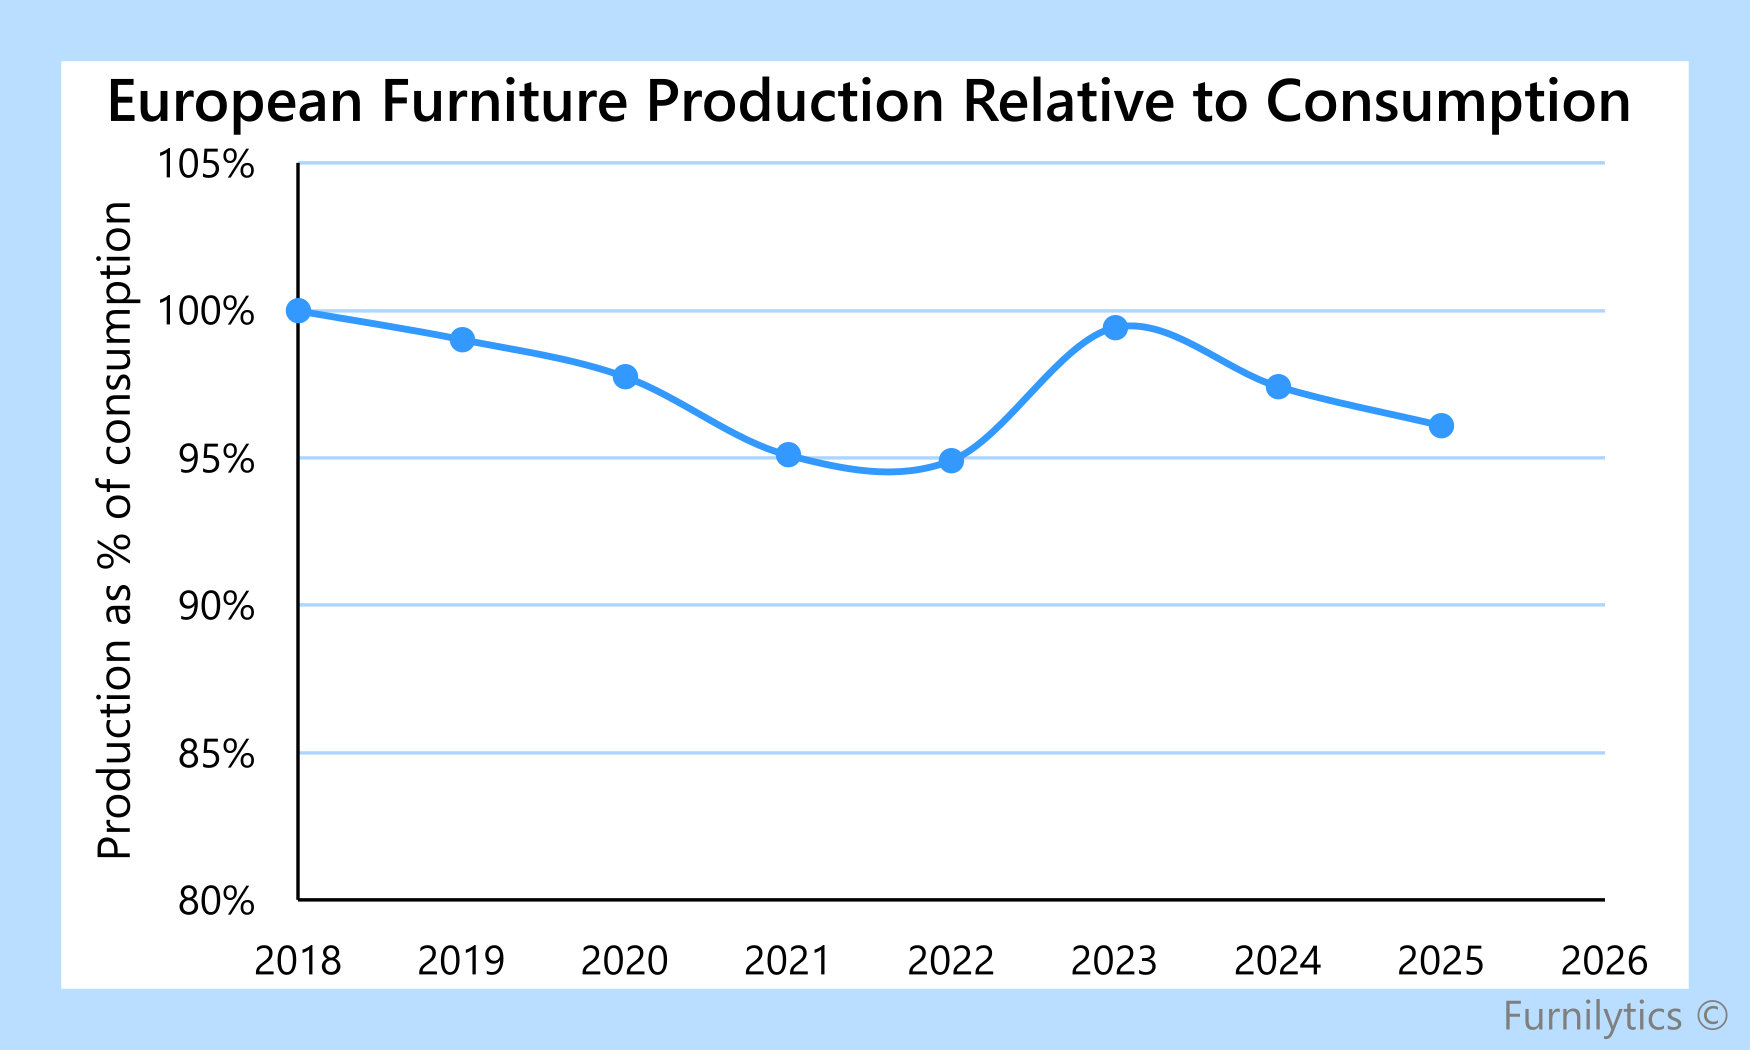
Europe’s furniture production base remains broadly comparable in size to its domestic market. In 2025, production reached EUR 124.6bn, compared with apparent consumption of EUR 129.7bn, meaning production was equivalent to around 96% of consumption.
The balance has weakened moderately since 2018, when production and apparent consumption were both around EUR 107.3bn. The ratio fell to about 95% in 2021-2022, recovered to 99% in 2023, and declined again in 2024-2025.
After accounting for exports outside Europe, an estimated 86% of European furniture consumption in 2025 could be supplied by European production retained within the region, compared with around 90% in 2018. This highlights that Europe remains highly reliant on its own production base, even though external sourcing has gained some importance.
Concentration of European furniture production
The European aggregate hides a highly uneven production structure. Several countries maintain furniture industries that are much larger than their domestic markets, while others depend far more on imported supply.
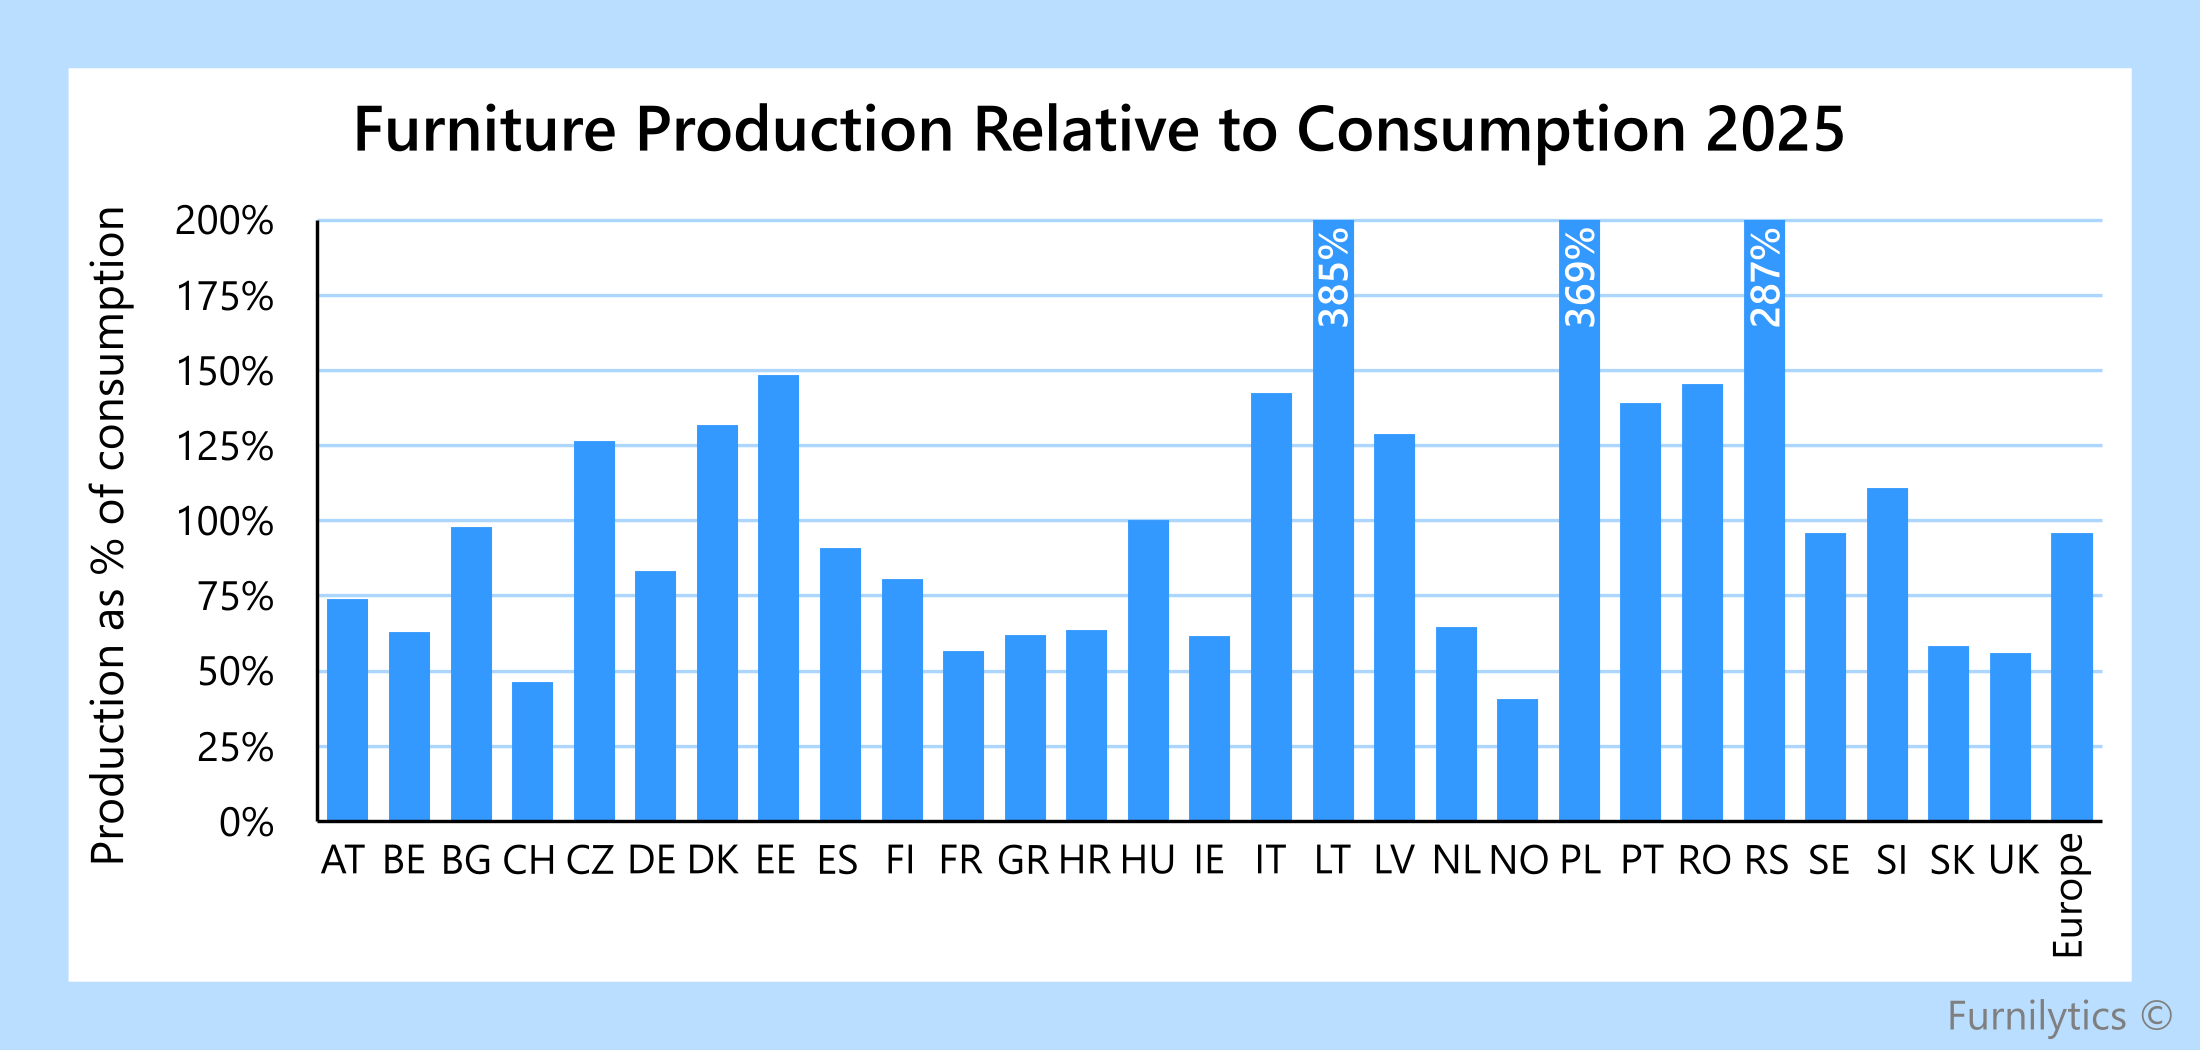
This is particularly visible in manufacturing-oriented markets such as Poland, Italy and Romania, where production ranges from roughly 140% to well above 300% of apparent consumption. Smaller export-oriented markets such as Lithuania and Serbia reach similarly high ratios relative to their domestic market size.
At the other end, countries including the UK, France, Switzerland and Norway produce only around 40–60% of domestic consumption. Even Germany, despite being one of Europe’s largest producers in absolute terms, reaches only about 83%. The result is a strongly interconnected European market, where production surpluses in some countries help offset structural deficits elsewhere.
Regional furniture import sourcing
European furniture imports remain predominantly regional. In 2025, 69% of import value originated within Europe: 29% from countries sharing a land border with the importing market and 40% from elsewhere in Europe. The remaining 31% came from outside Europe.
Put against the size of the market, total imports were equivalent to around 60% of European apparent consumption. Imports originating within Europe represented about 42% of consumption, compared with approximately 19% for non-European imports. This highlights the importance of cross-border European trade: countries with production deficits often source a substantial part of their imported furniture from elsewhere within Europe.
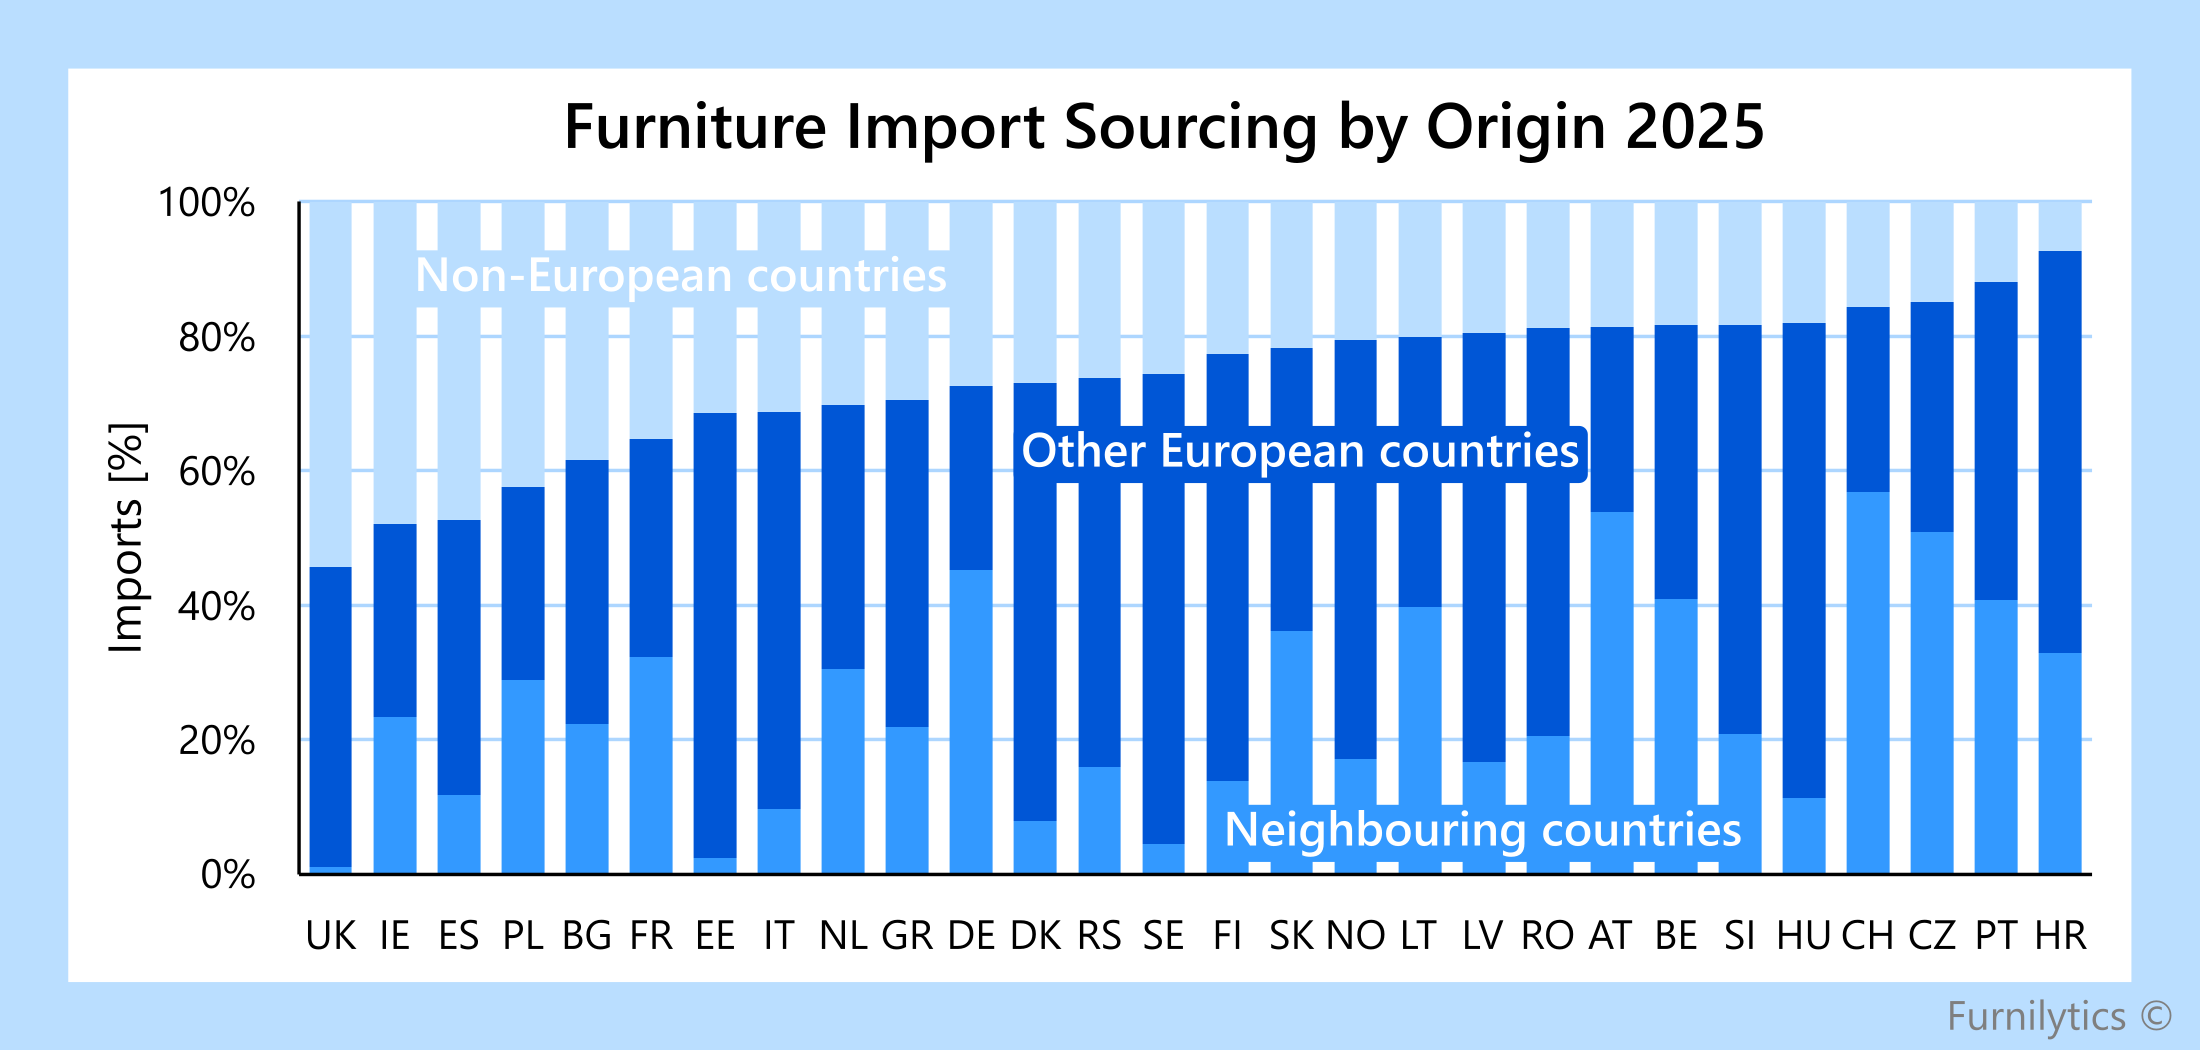
Country-level sourcing patterns vary substantially. Austria, Switzerland and Czechia source more than half of their furniture imports from directly bordering countries, indicating highly regional supply chains. In the Nordics and parts of Central and Eastern Europe, imports are more often sourced from the wider European market rather than immediate neighbours.
By contrast, the UK, Ireland and Spain are considerably more exposed to non-European supply, with roughly 47–54% of imports originating outside Europe. France and the Netherlands sit closer to the European average, while markets such as Croatia, Portugal and Czechia remain much more dependent on European suppliers.
Conclusion
Europe’s furniture market is closely interconnected. While the region as a whole maintains a production base close to the size of its domestic market, production capacity is distributed very unevenly between countries. Some markets produce far more than they consume, while others depend heavily on imports. In practice, these imbalances are largely absorbed within Europe itself: 69% of furniture import value comes from other European countries.
The result is a market in which European countries depend heavily on one another. Production clusters, neighbouring markets and wider intra-European trade together form a shared supply network that is central to how Europe’s furniture market functions.
Sources:
Furnilytics European furniture production methodology
United Nations - Comtrade
Eurostat - international trade in goods and Comext
European Central Bank - exchange rates
Methodology & limitations:
Trade covers selected furniture-related HS6 products aligned with NACE C31. The selection includes furniture, seating, furniture parts, mattresses and mattress supports while excluding non-furniture HS94 products. UN Comtrade is the primary source, with Eurostat Comext used for recent missing EU observations.
Note: This analysis uses a more specific HS6 furniture product selection than most of the Furnilytics trade indicators, so the figures are not directly comparable.
Partners are classified as neighbouring, other European or extra-European countries. Neighbours share a continental land border with the reporting country. Ukraine is included as a European partner but excluded as a reporting country.
Apparent consumption equals C31 production plus imports minus exports. Production is converted to US dollars using ECB exchange rates. This is a market-balance estimate, not household spending or value added. Ratios can exceed 100% because of re-exports, inventories and differences between trade and production coverage. The Europe aggregate covers 28 countries. Trade values are nominal and subject to revision.